Finance Charts Daily

Finance Charts Daily

G10 Excess Liquidity Falls To Lowest Level Since Early 2024

Finance Charts Daily's avatar
Finance Charts Daily
Oct 05, 2026
∙ Paid
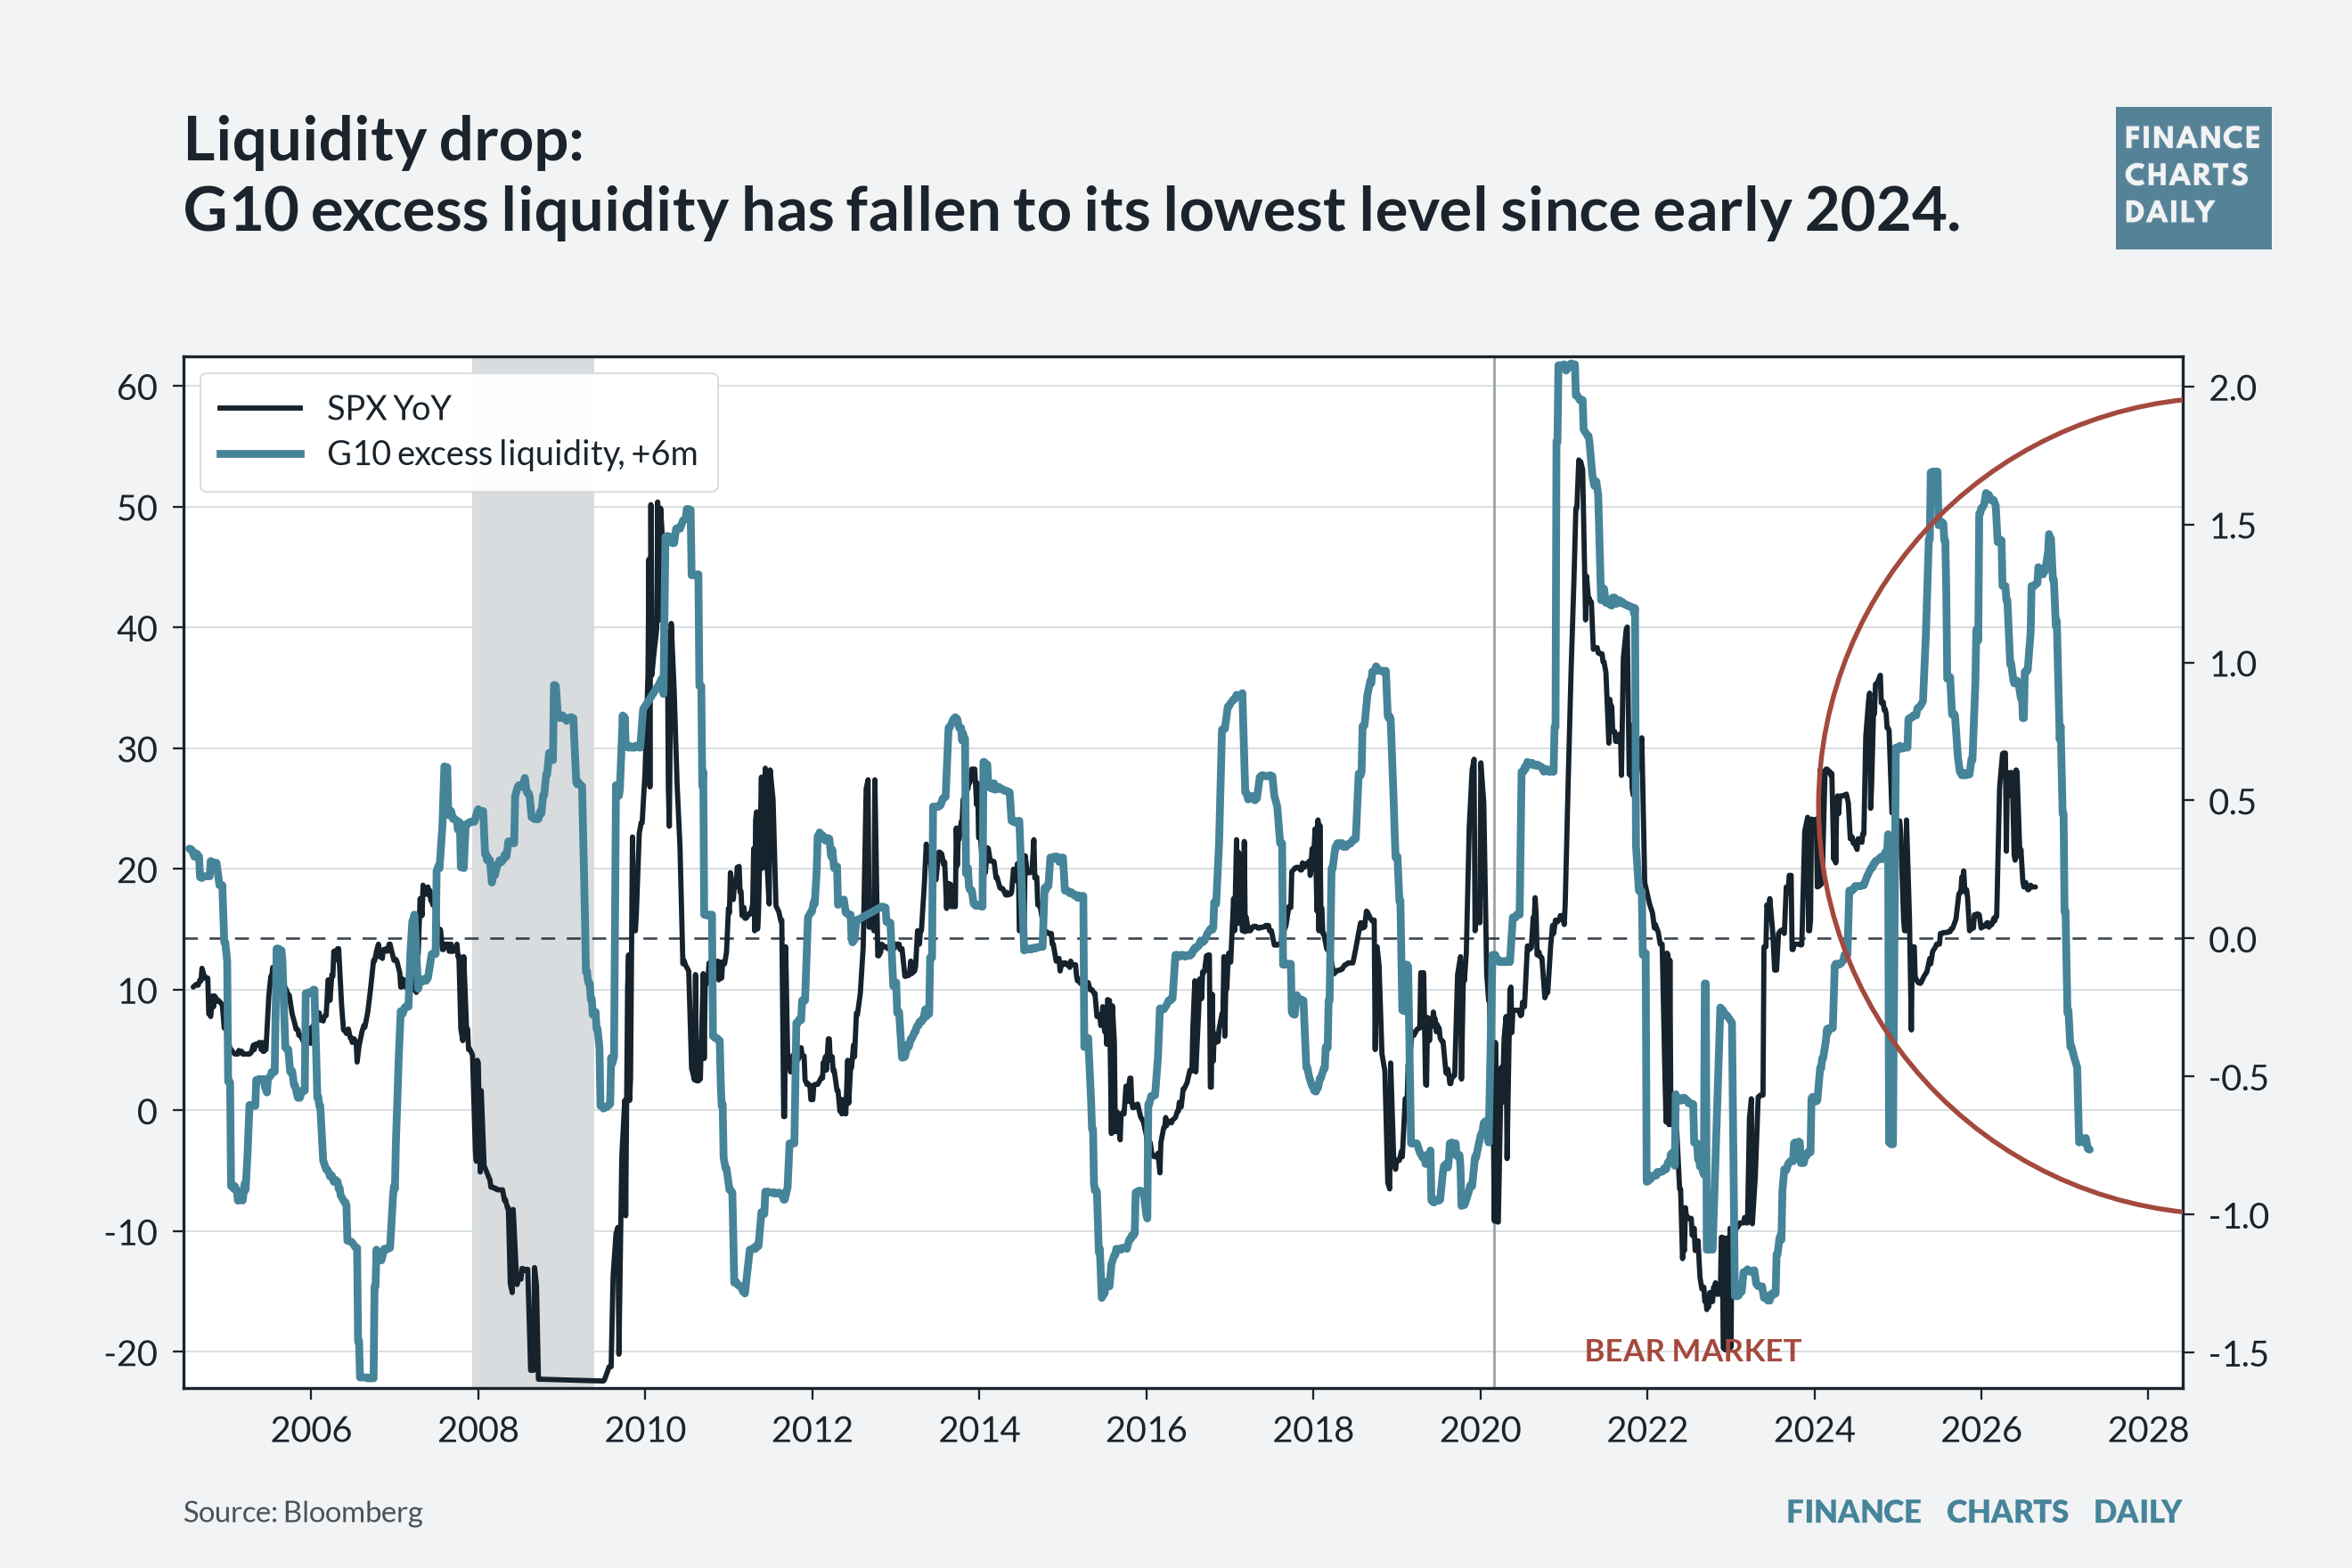
  1. Liquidity drop: G10 excess liquidity has fallen to its lowest level since early 2024.
Global Markets Observer


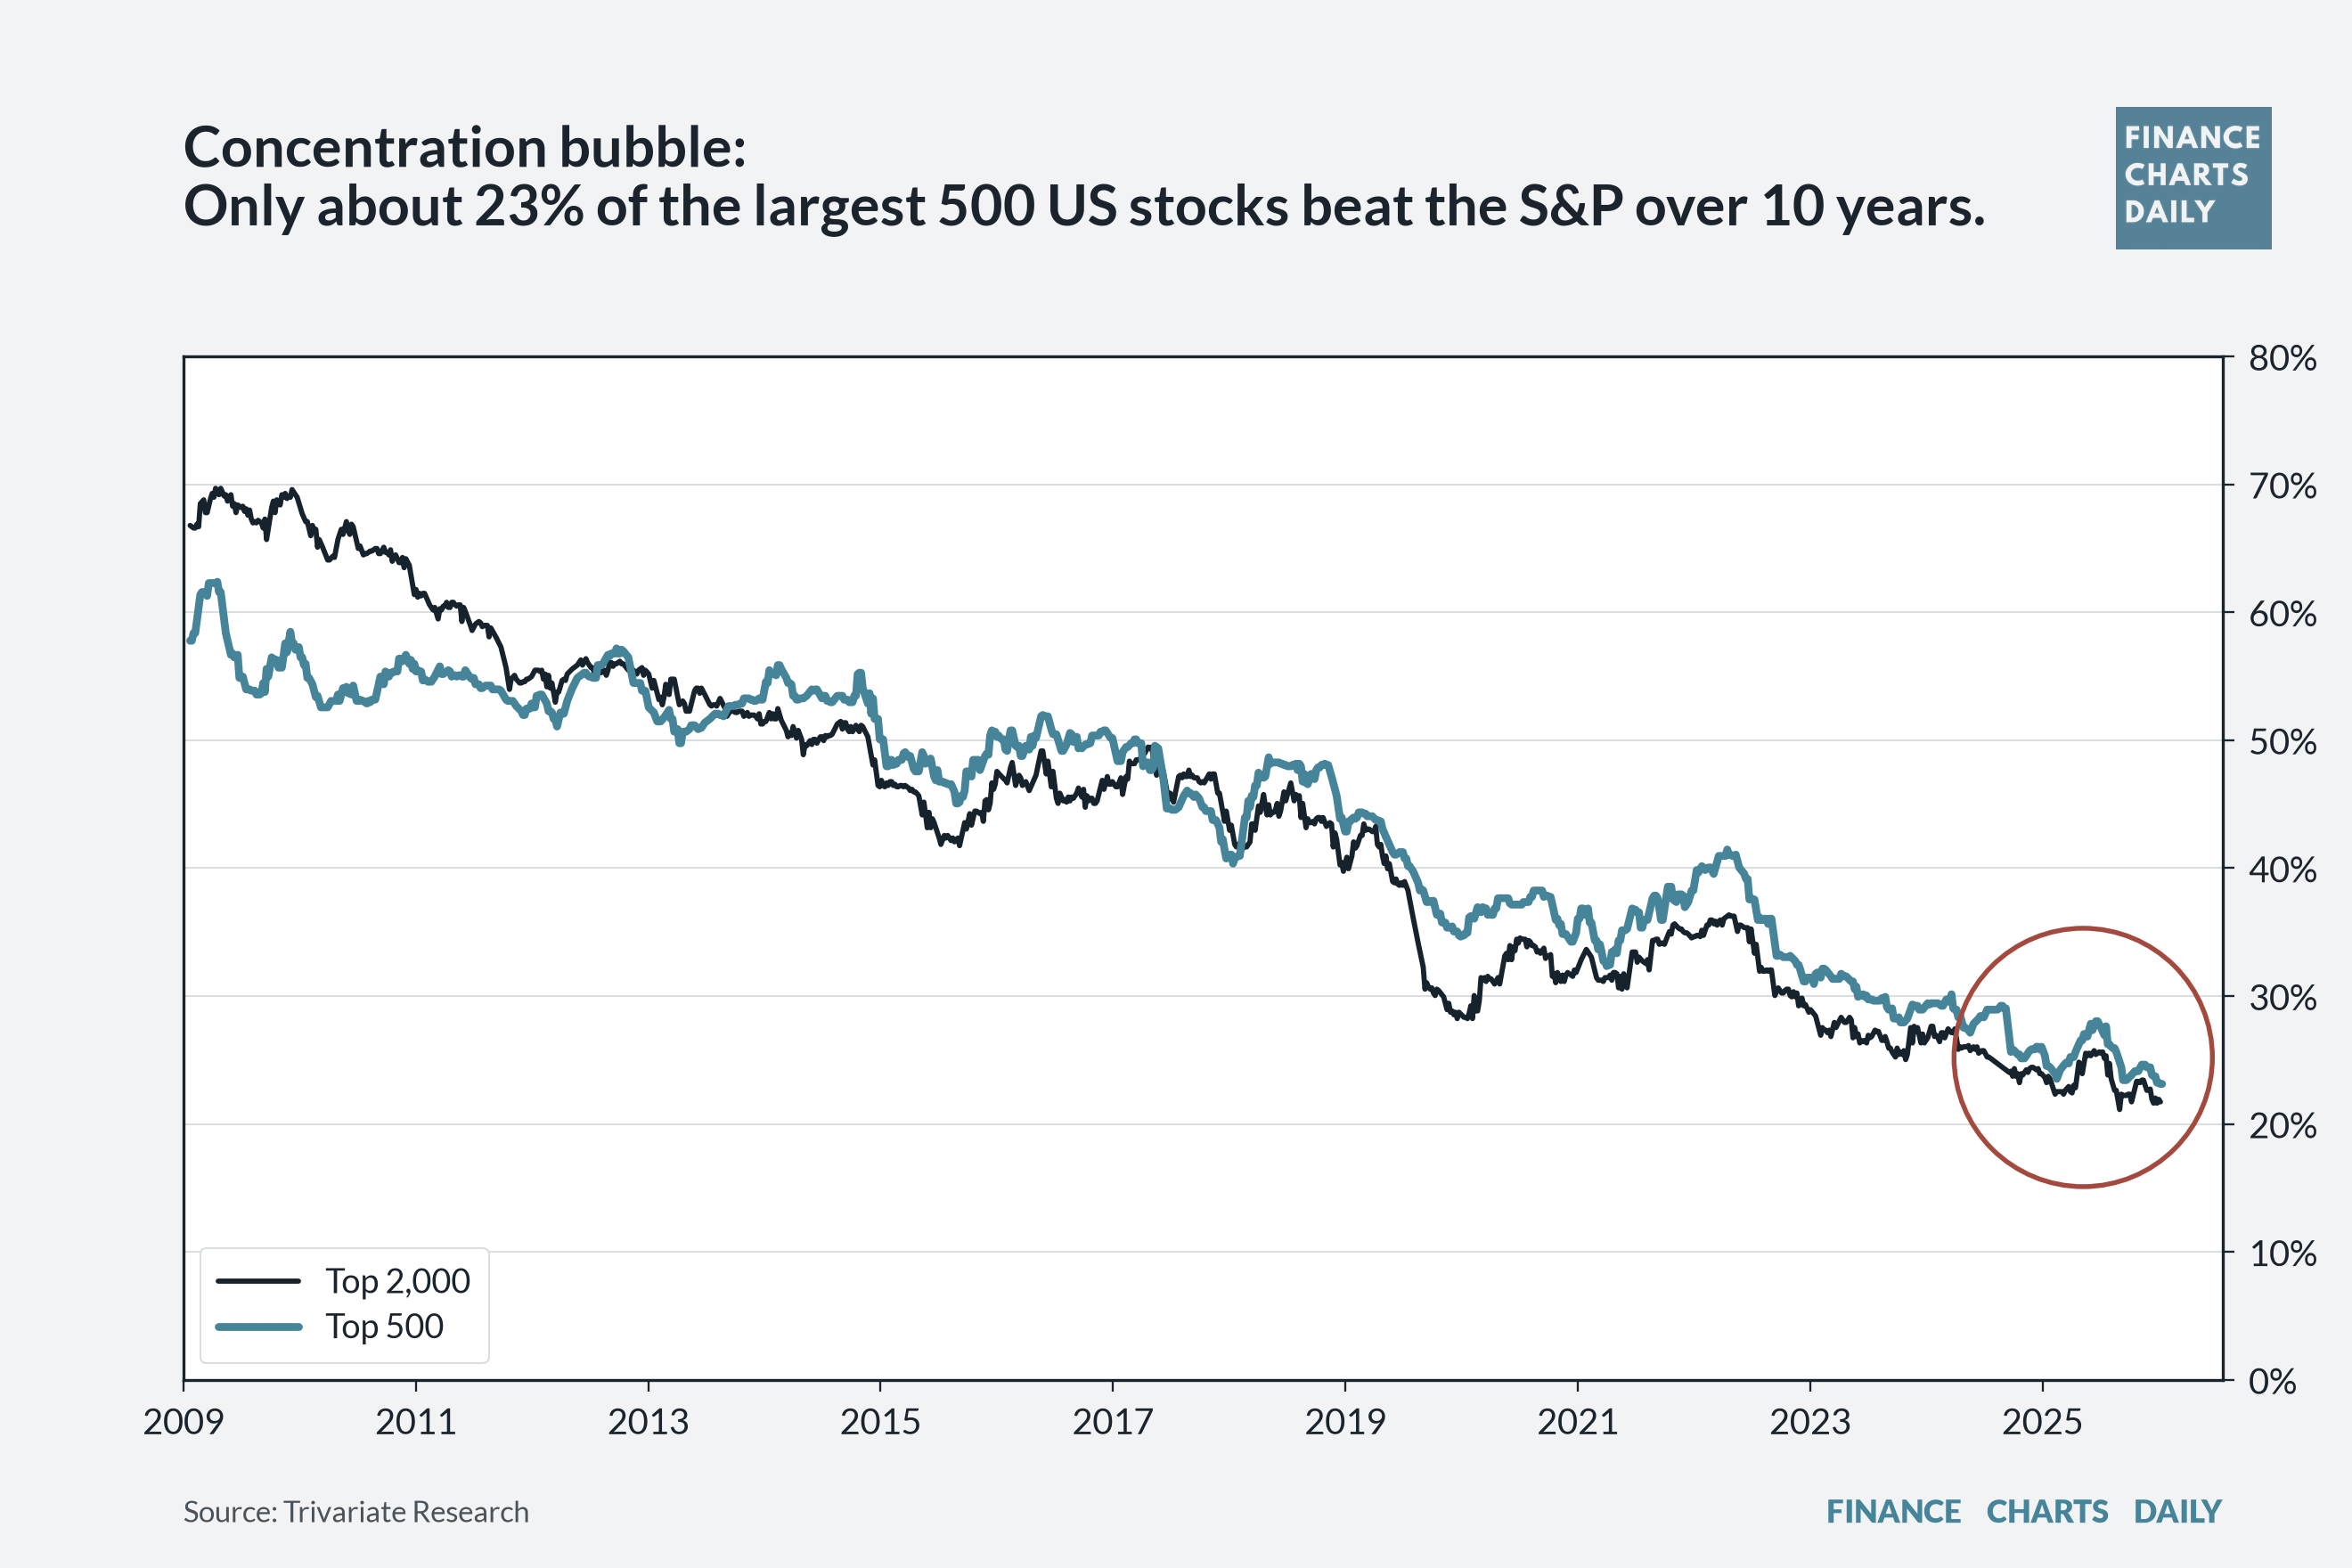
  1. Concentration bubble: Only about 23% of the largest 500 US stocks beat the S&P over 10 years.
Global Markets Observer


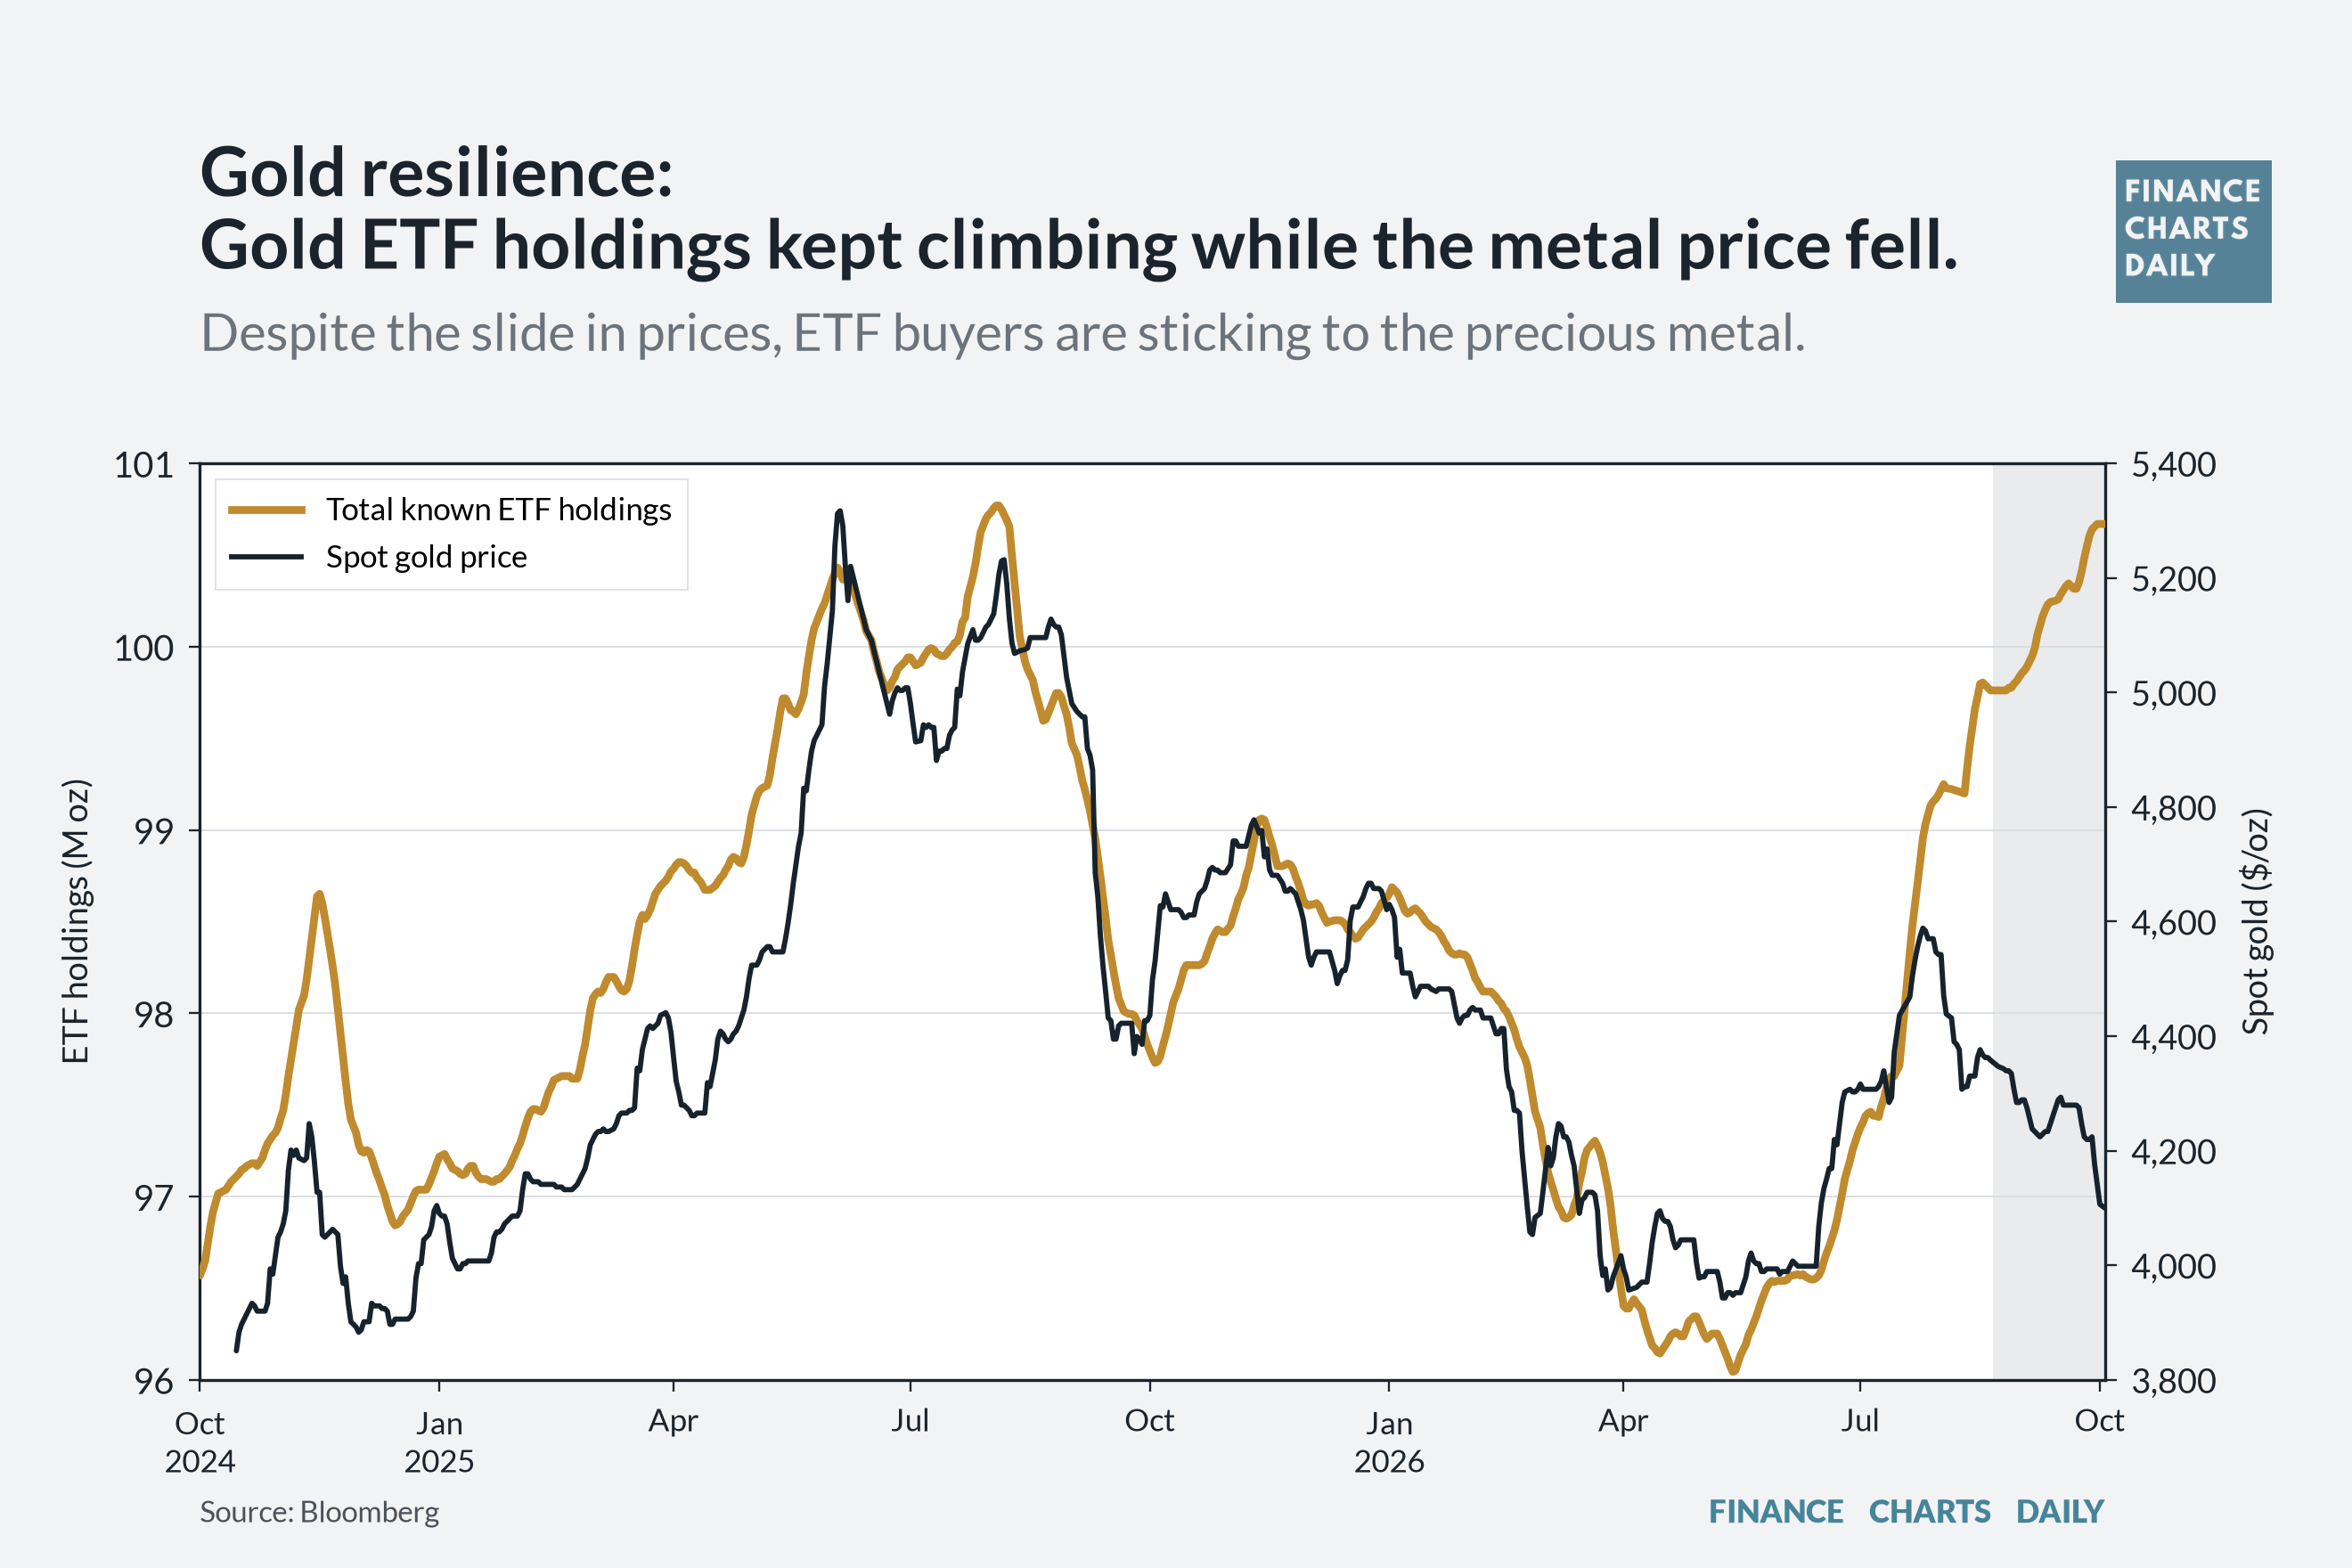
  1. Gold resilience: Gold ETF holdings kept climbing while the metal price fell.
Global Markets Observer


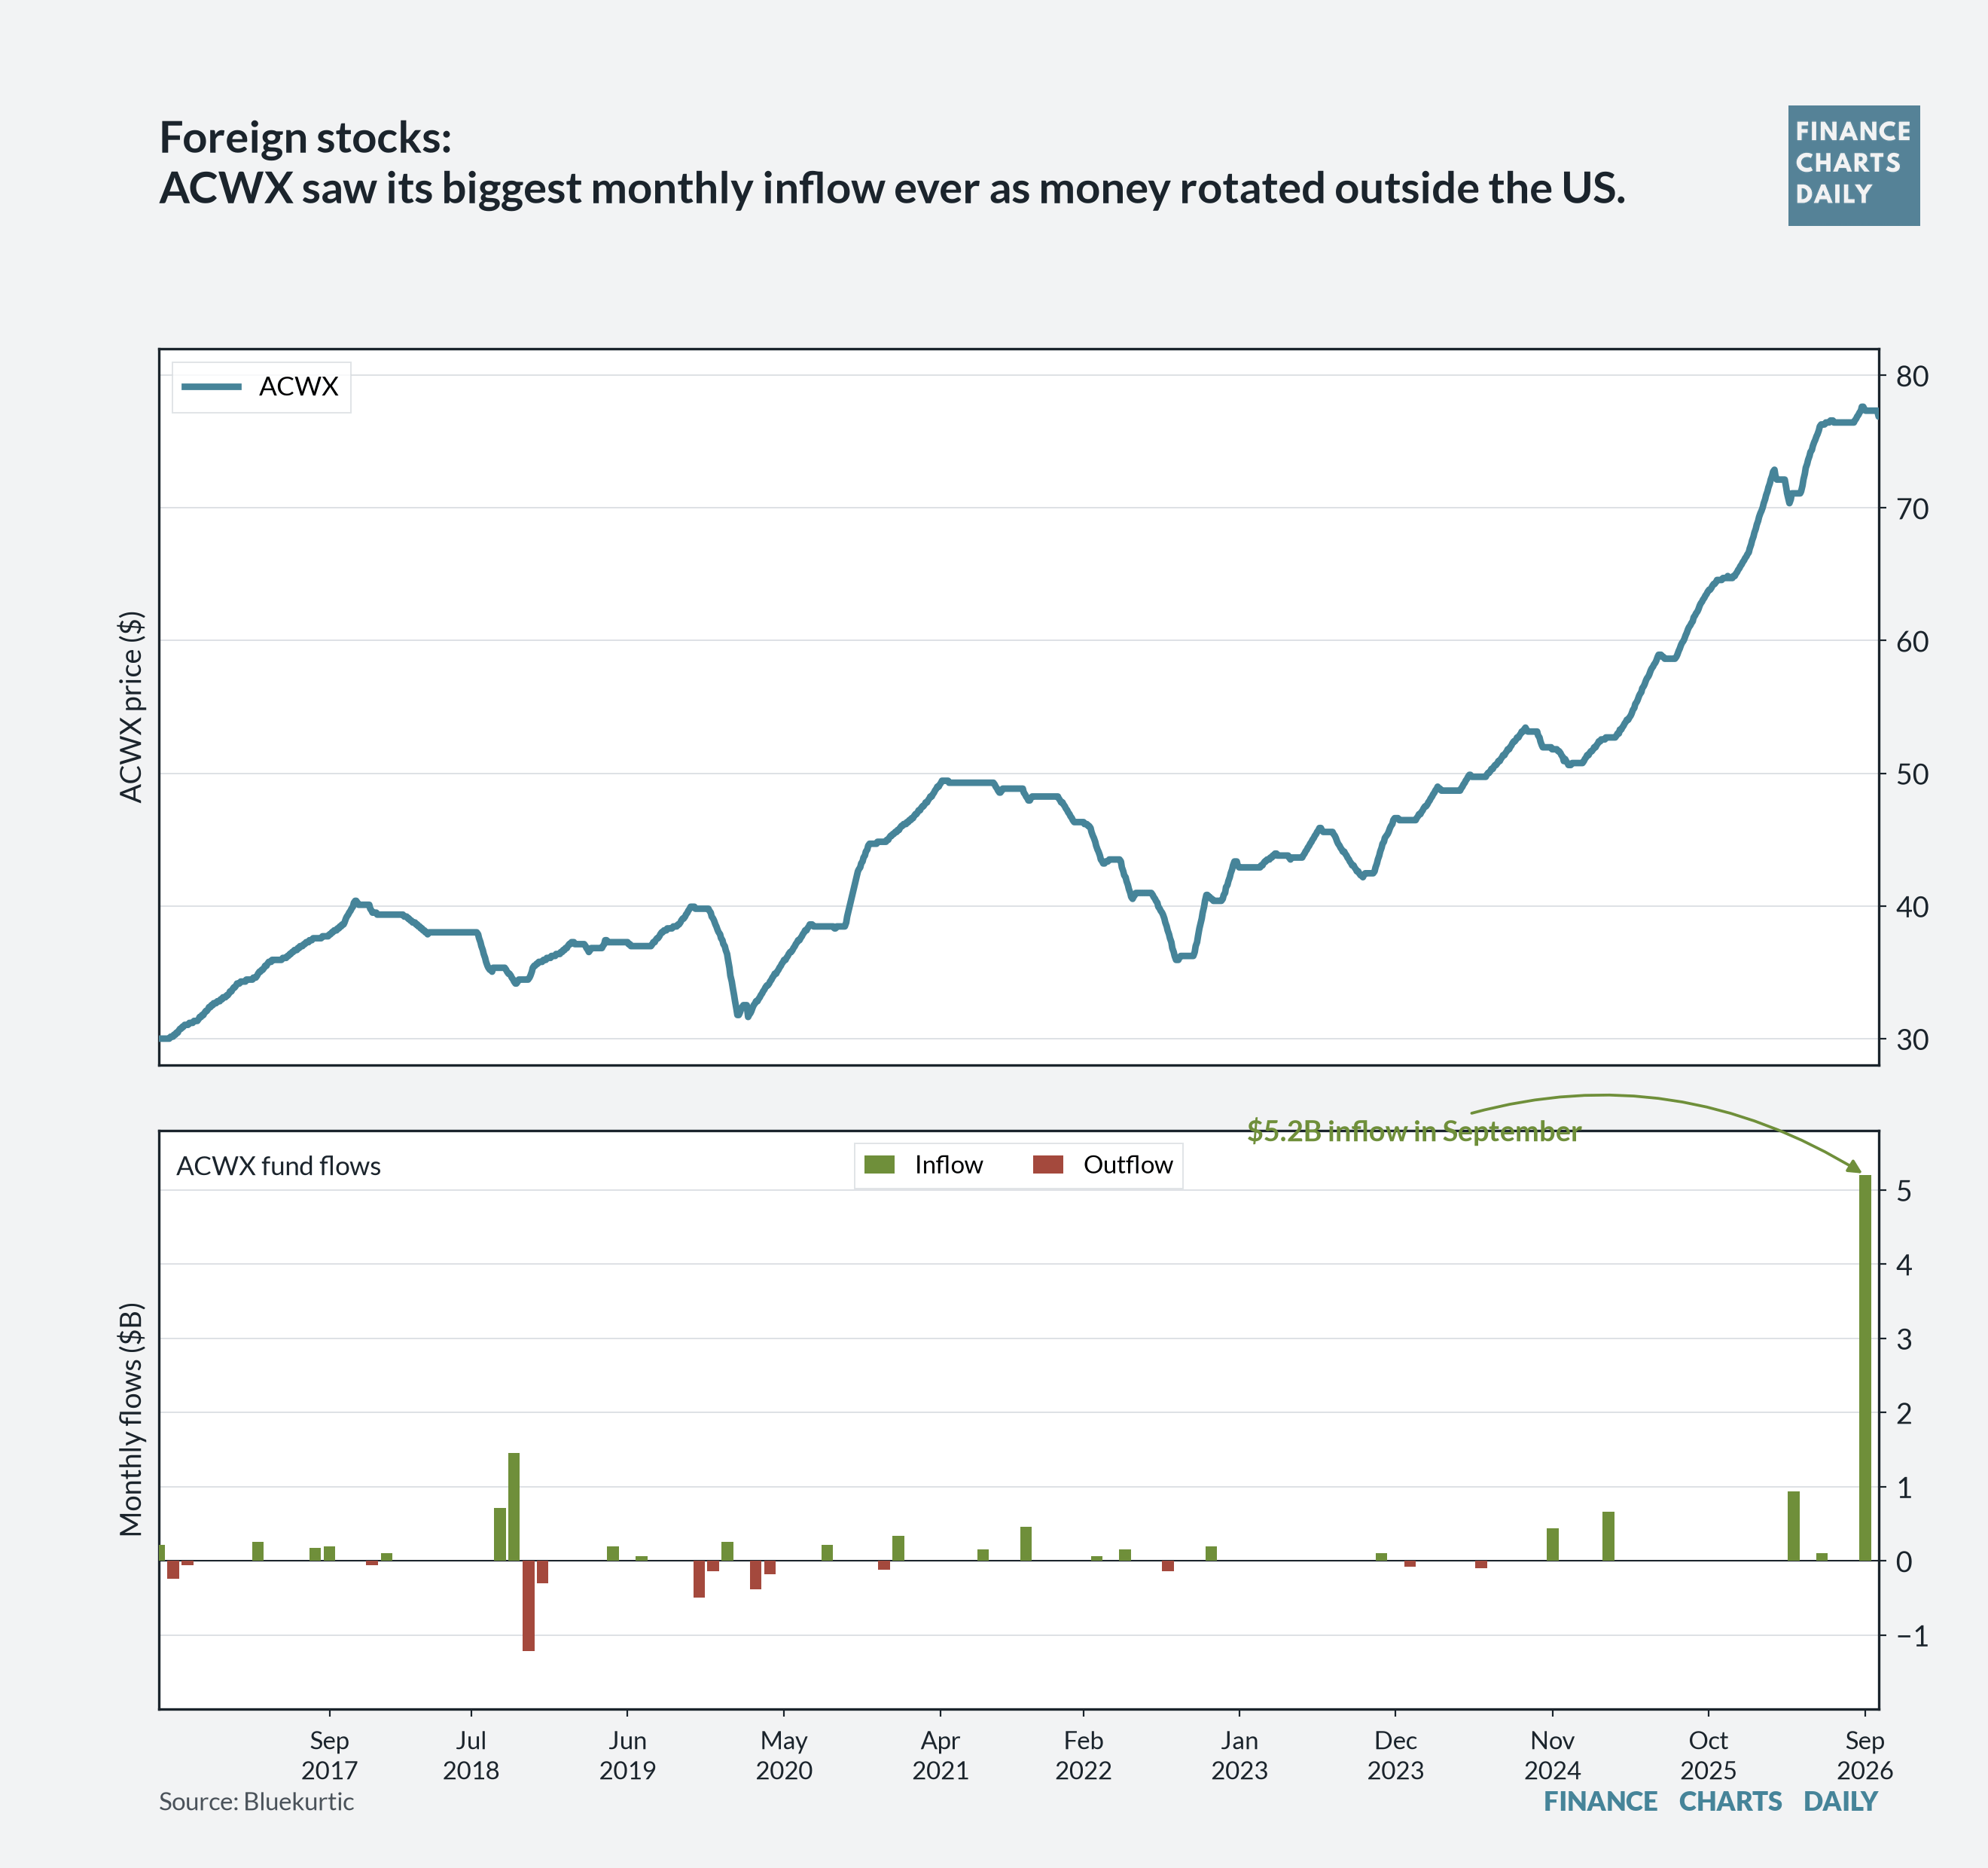
  1. Foreign stocks: ACWX saw its biggest monthly inflow ever as money rotated outside the US.
Bluekurtic


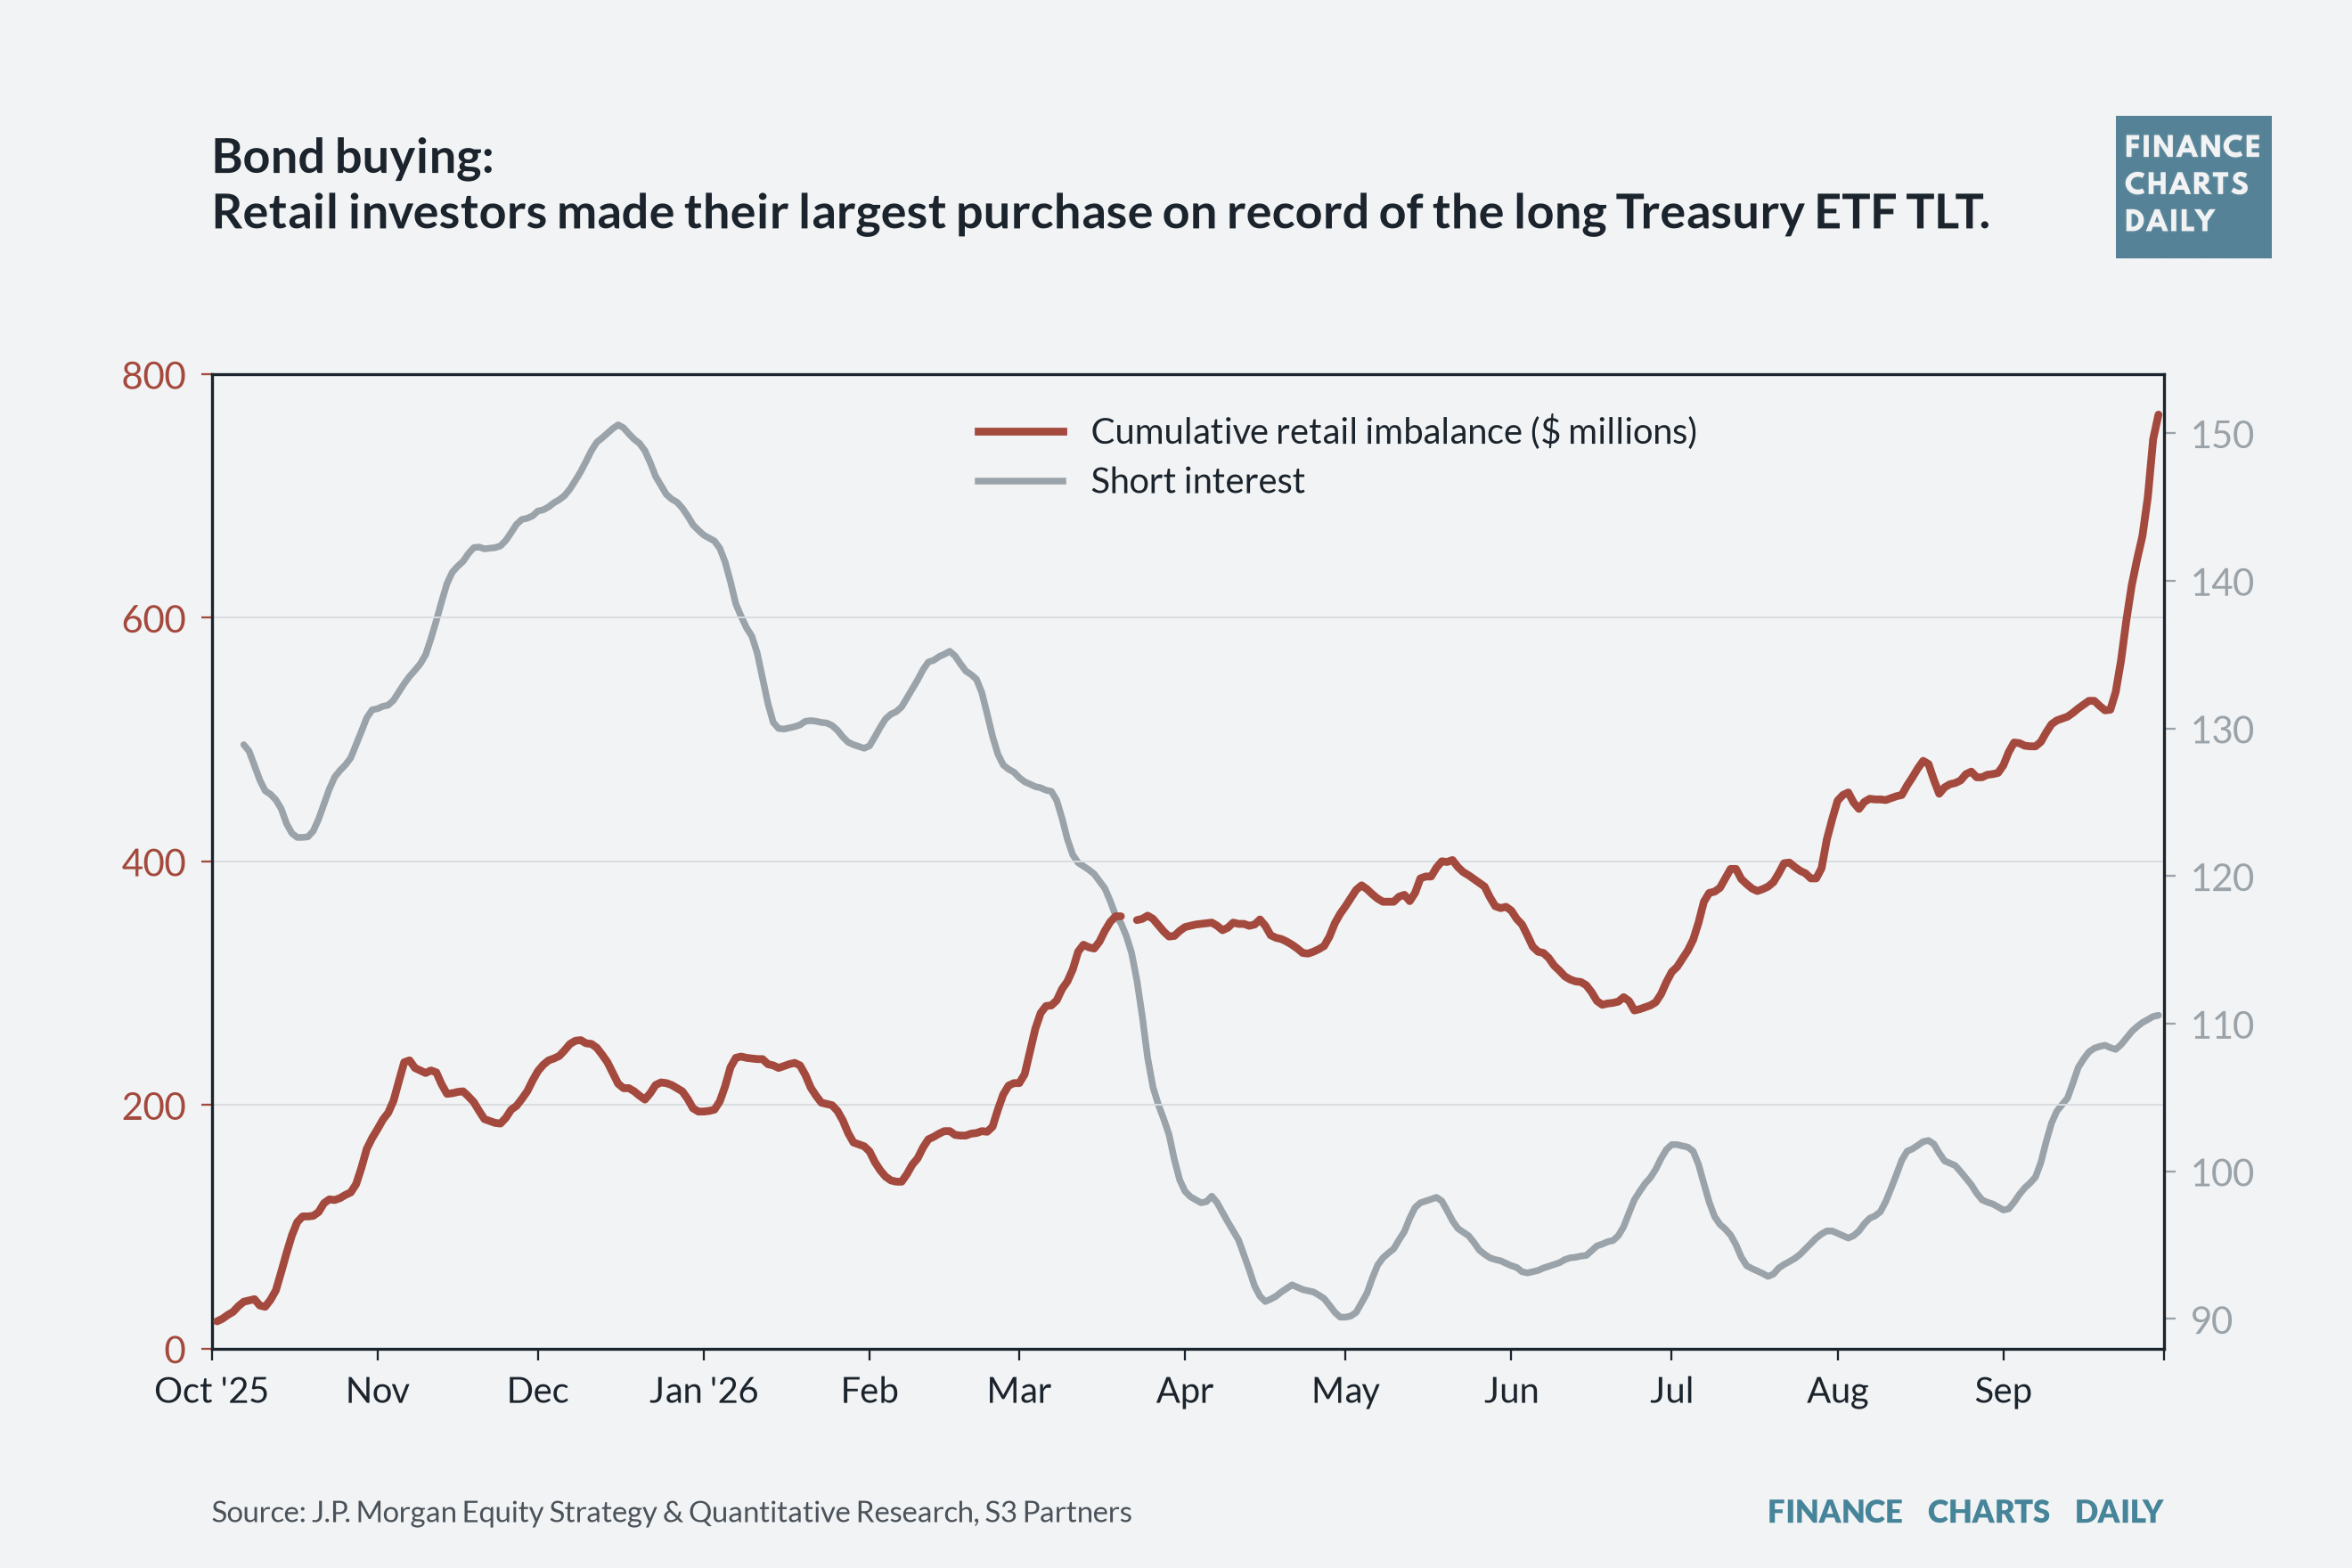
  1. Bond buying: Retail investors made their largest purchase on record of the long Treasury ETF TLT.
Global Markets Observer


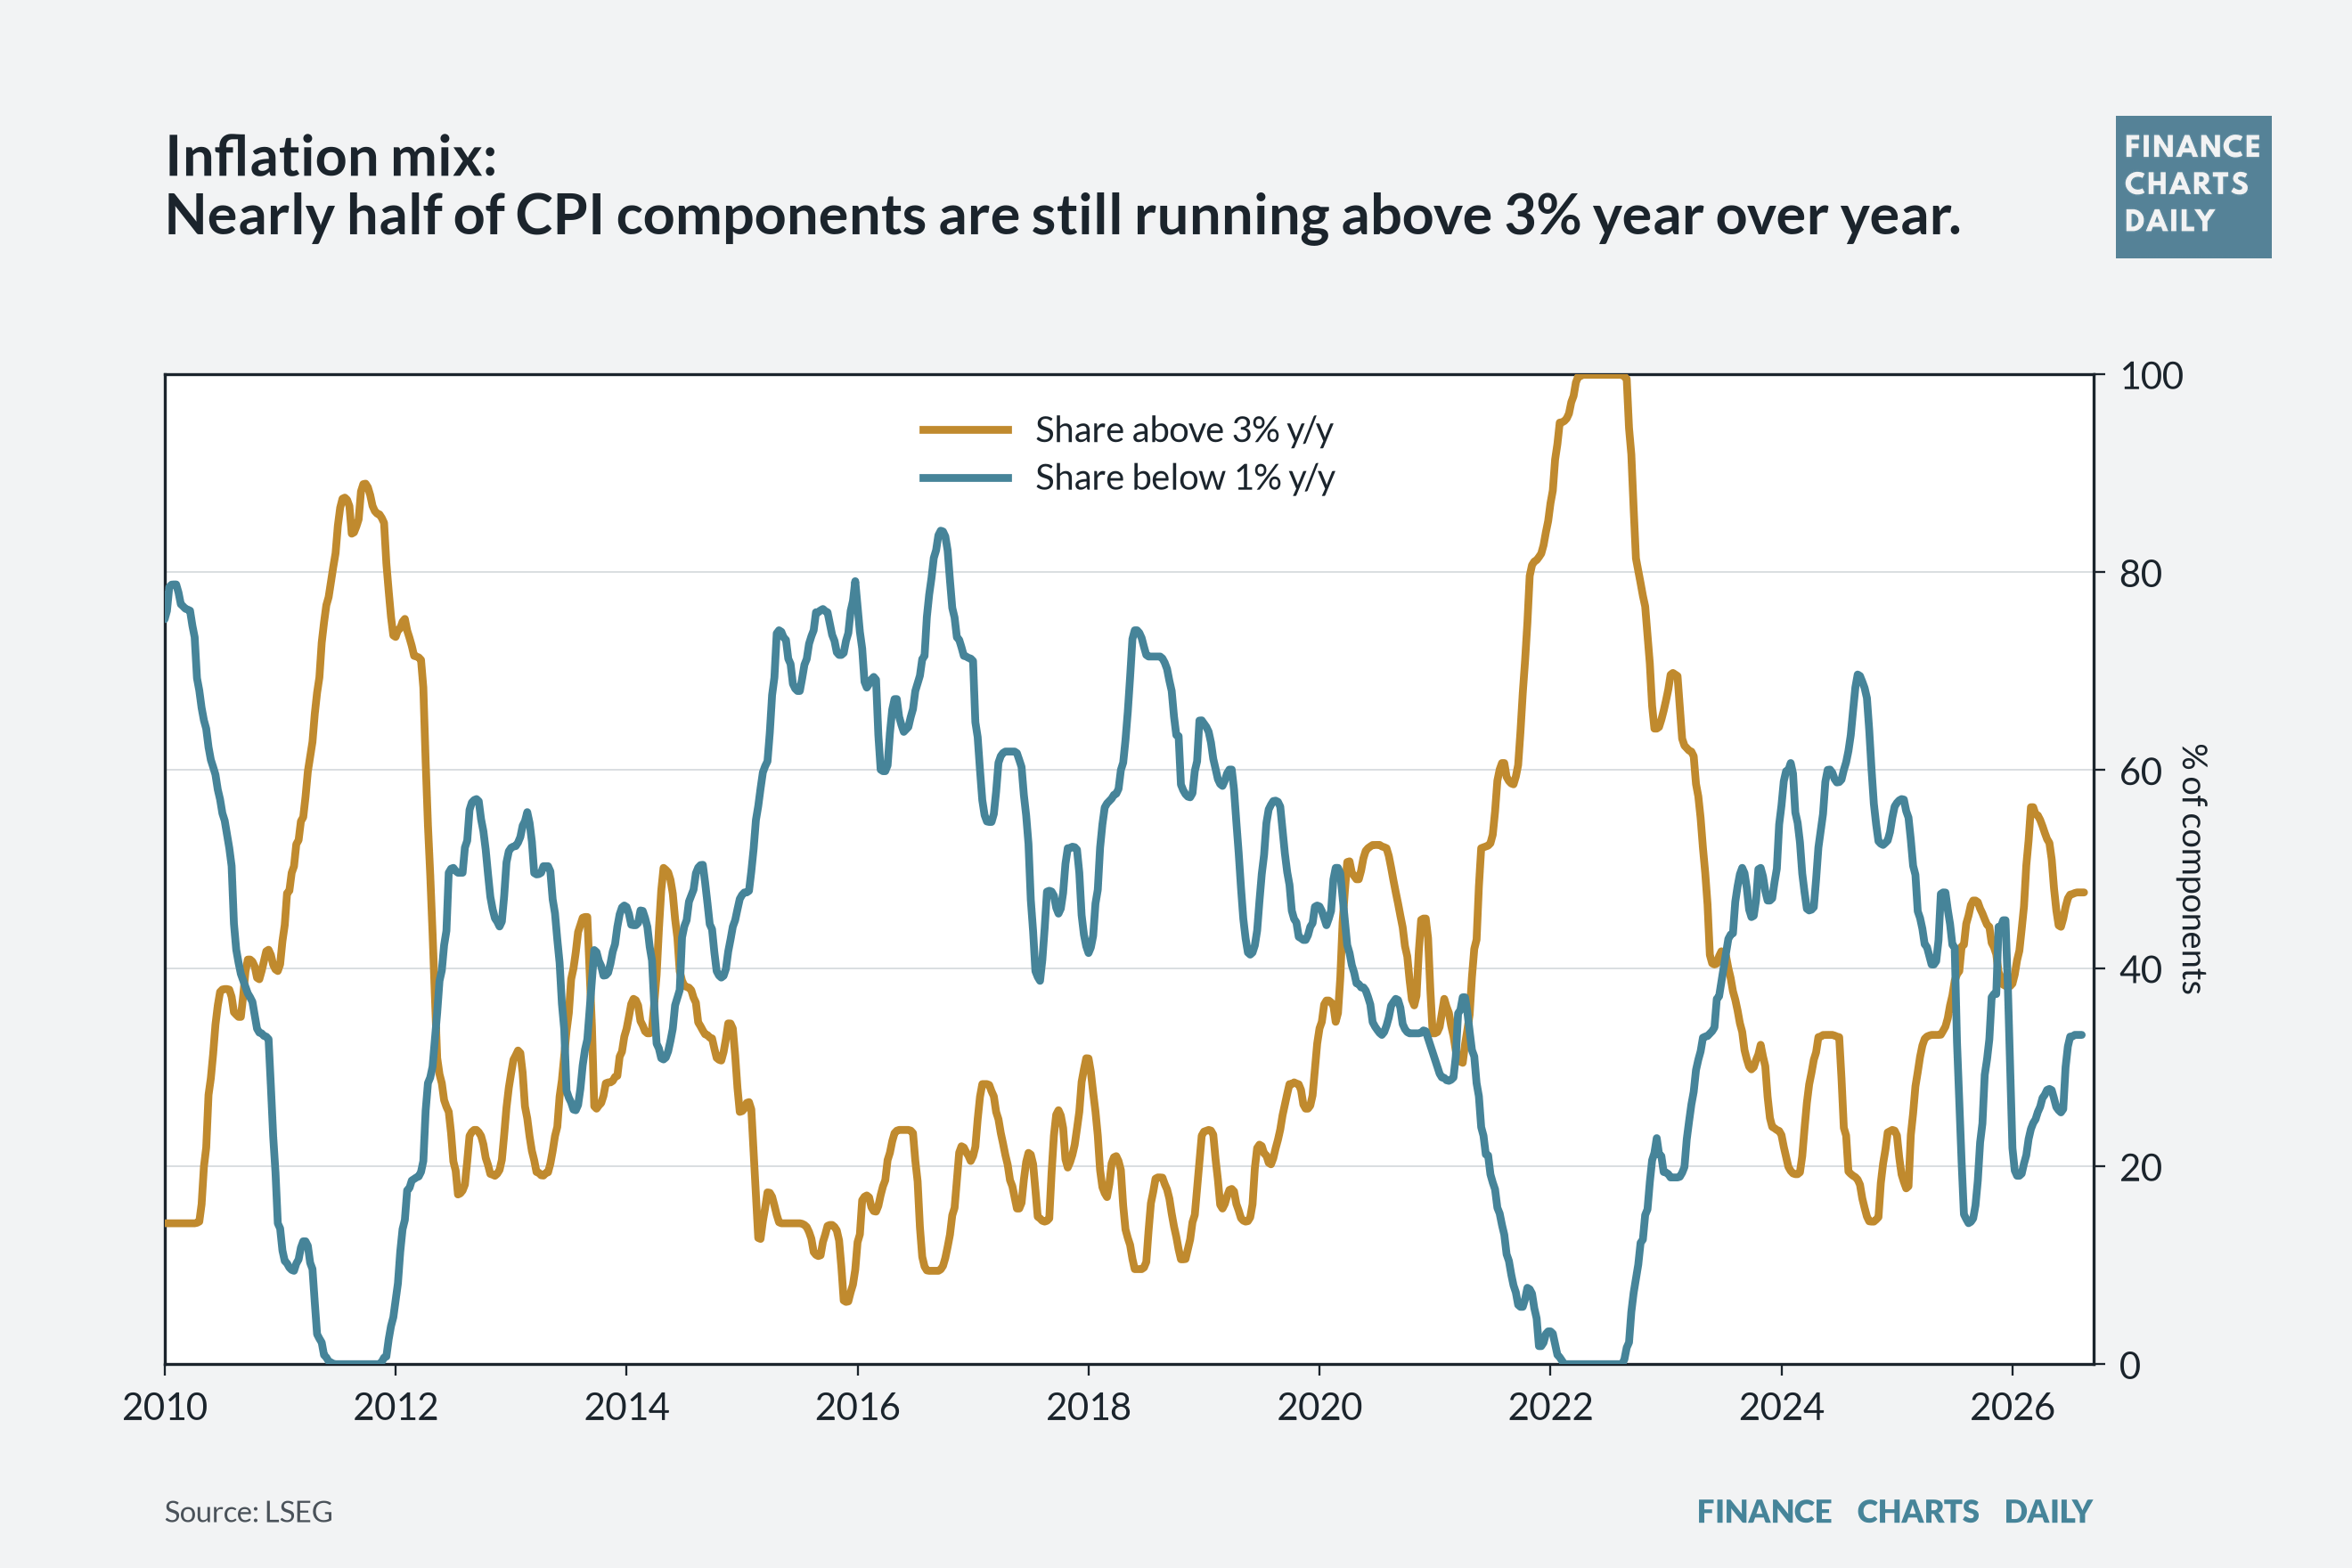
  1. Inflation mix: Nearly half of CPI components are still running above 3% year over year.
Deer Point Macro


User's avatar

Continue reading this post for free, courtesy of Mont Blanc Research.

Or purchase a paid subscription.
© 2026 Mont Blanc Research · Privacy ∙ Terms ∙ Collection notice
Start your SubstackGet the app
Substack is the home for great culture