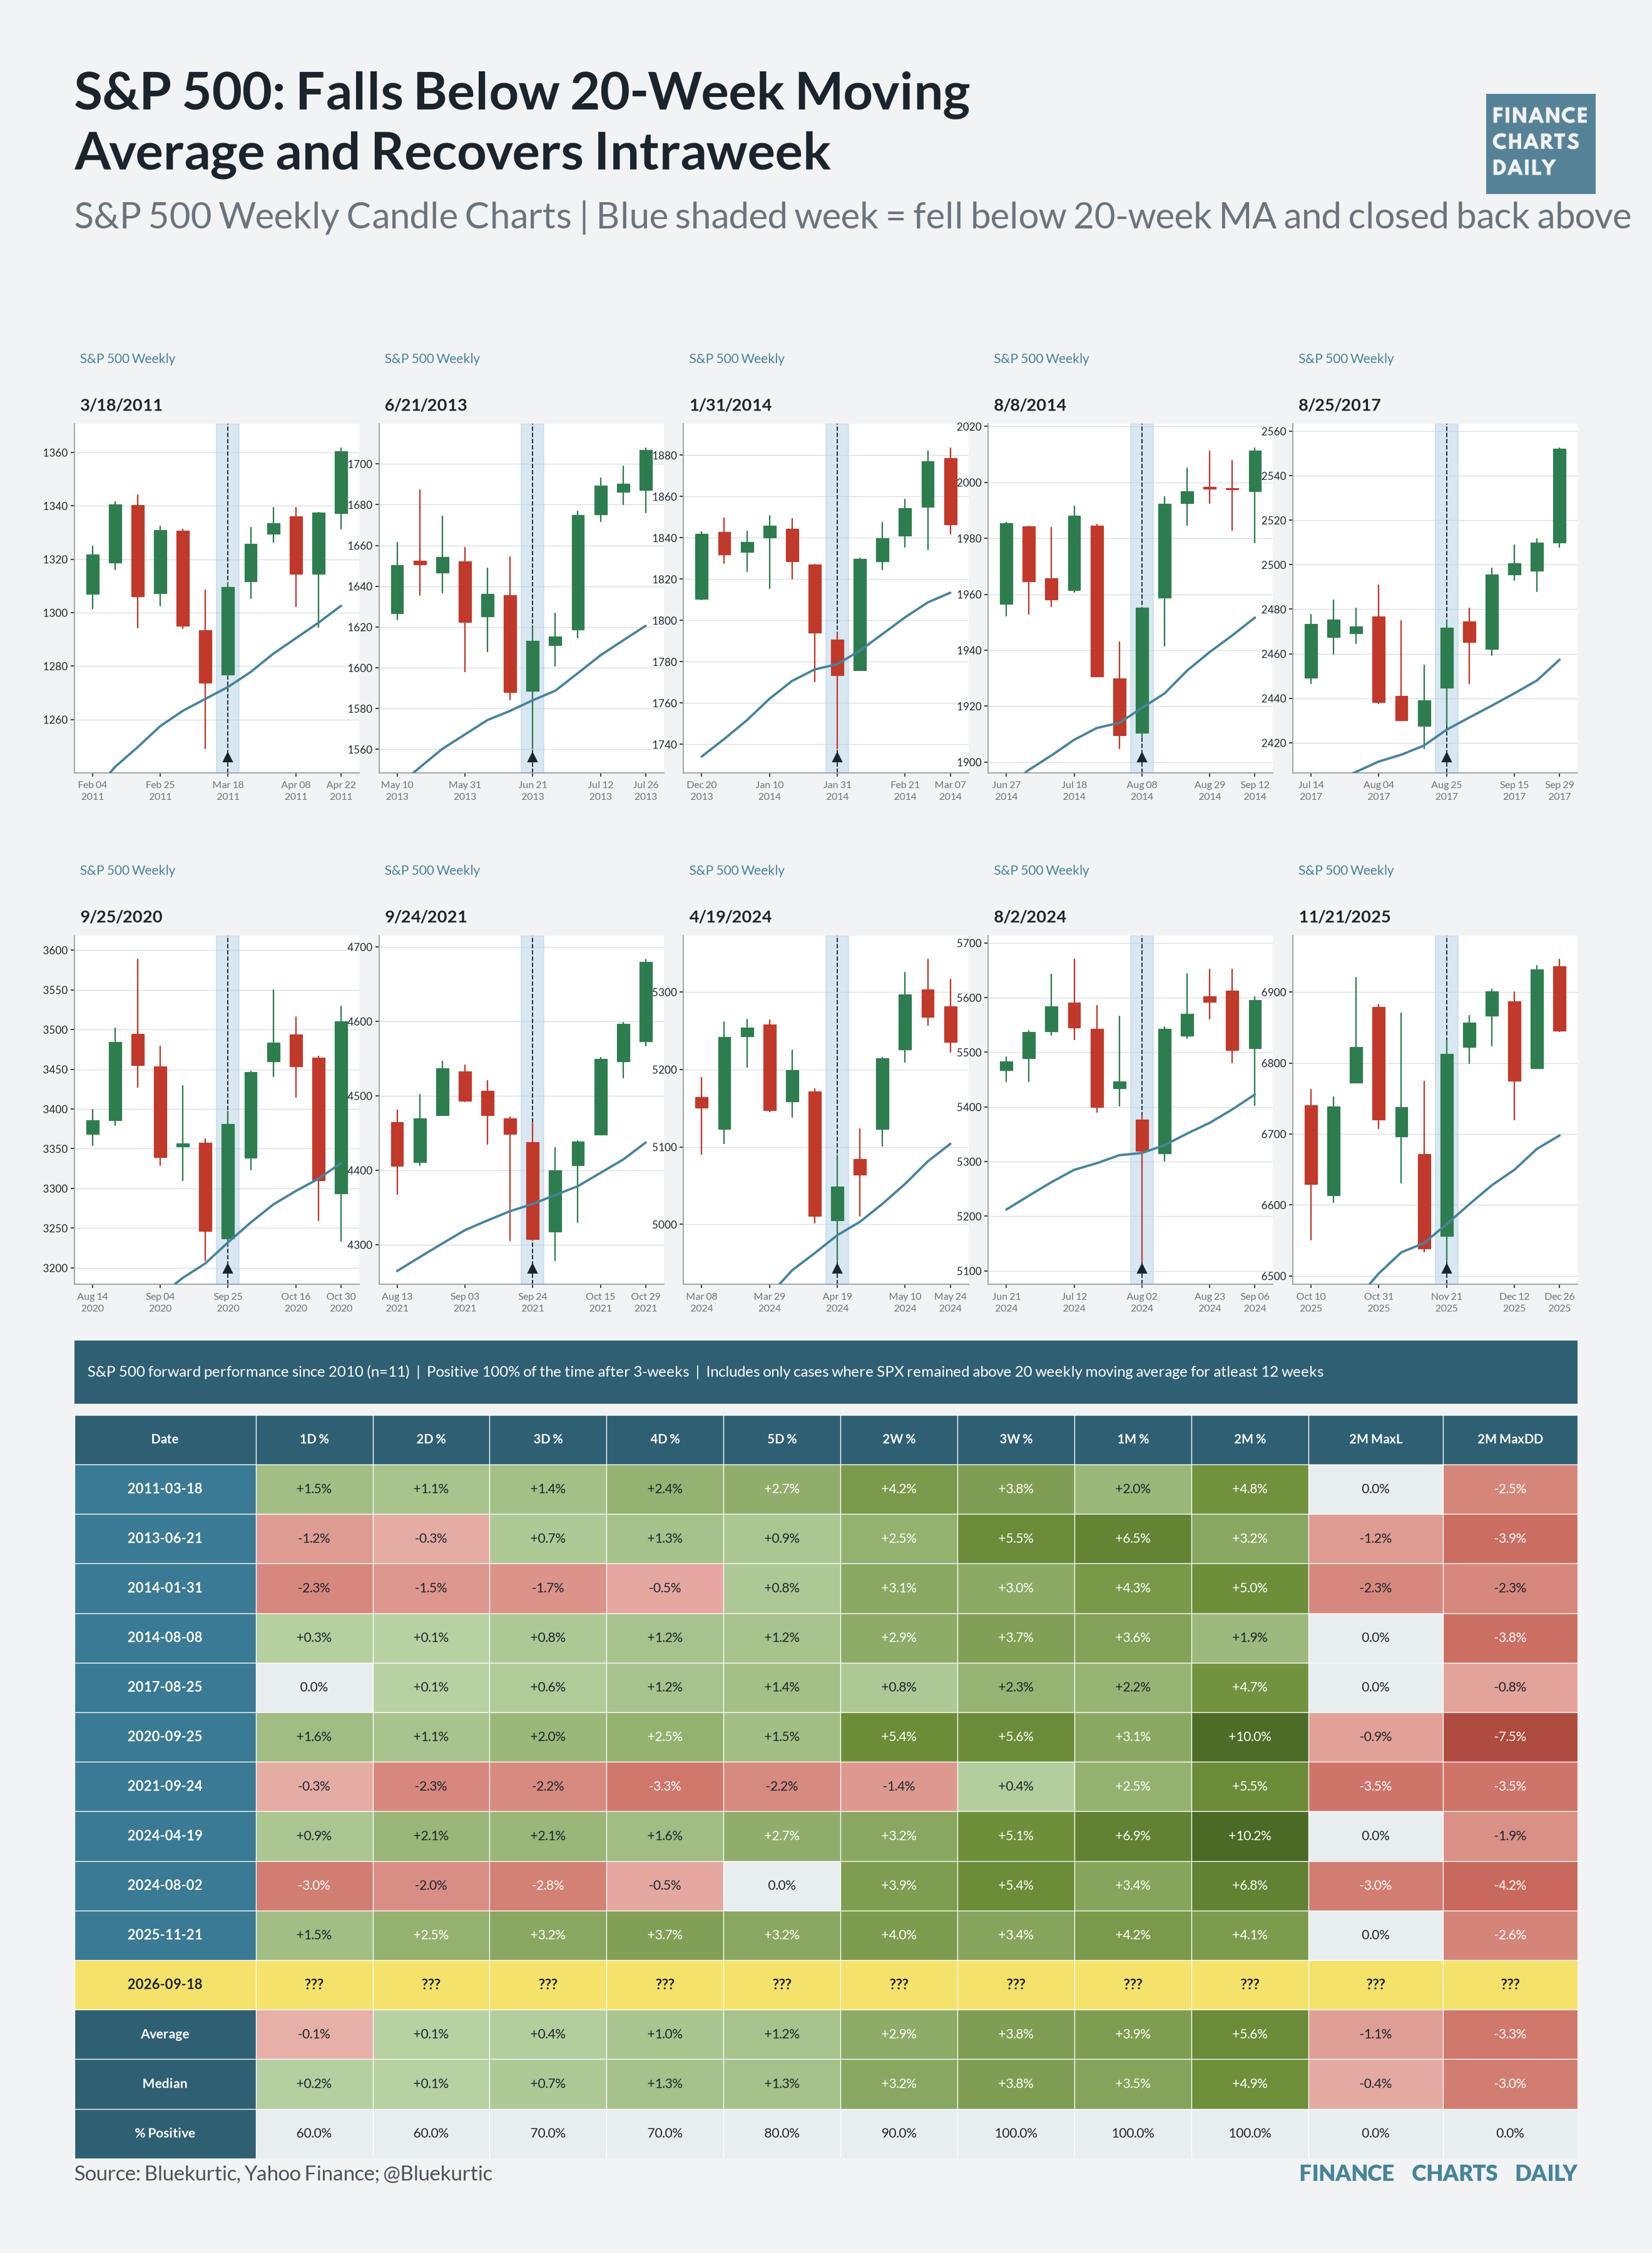
SPX rebound: The S&P recovered above its 20-week average after a brief break, a setup that has led higher within 3 weeks every time since 2010.
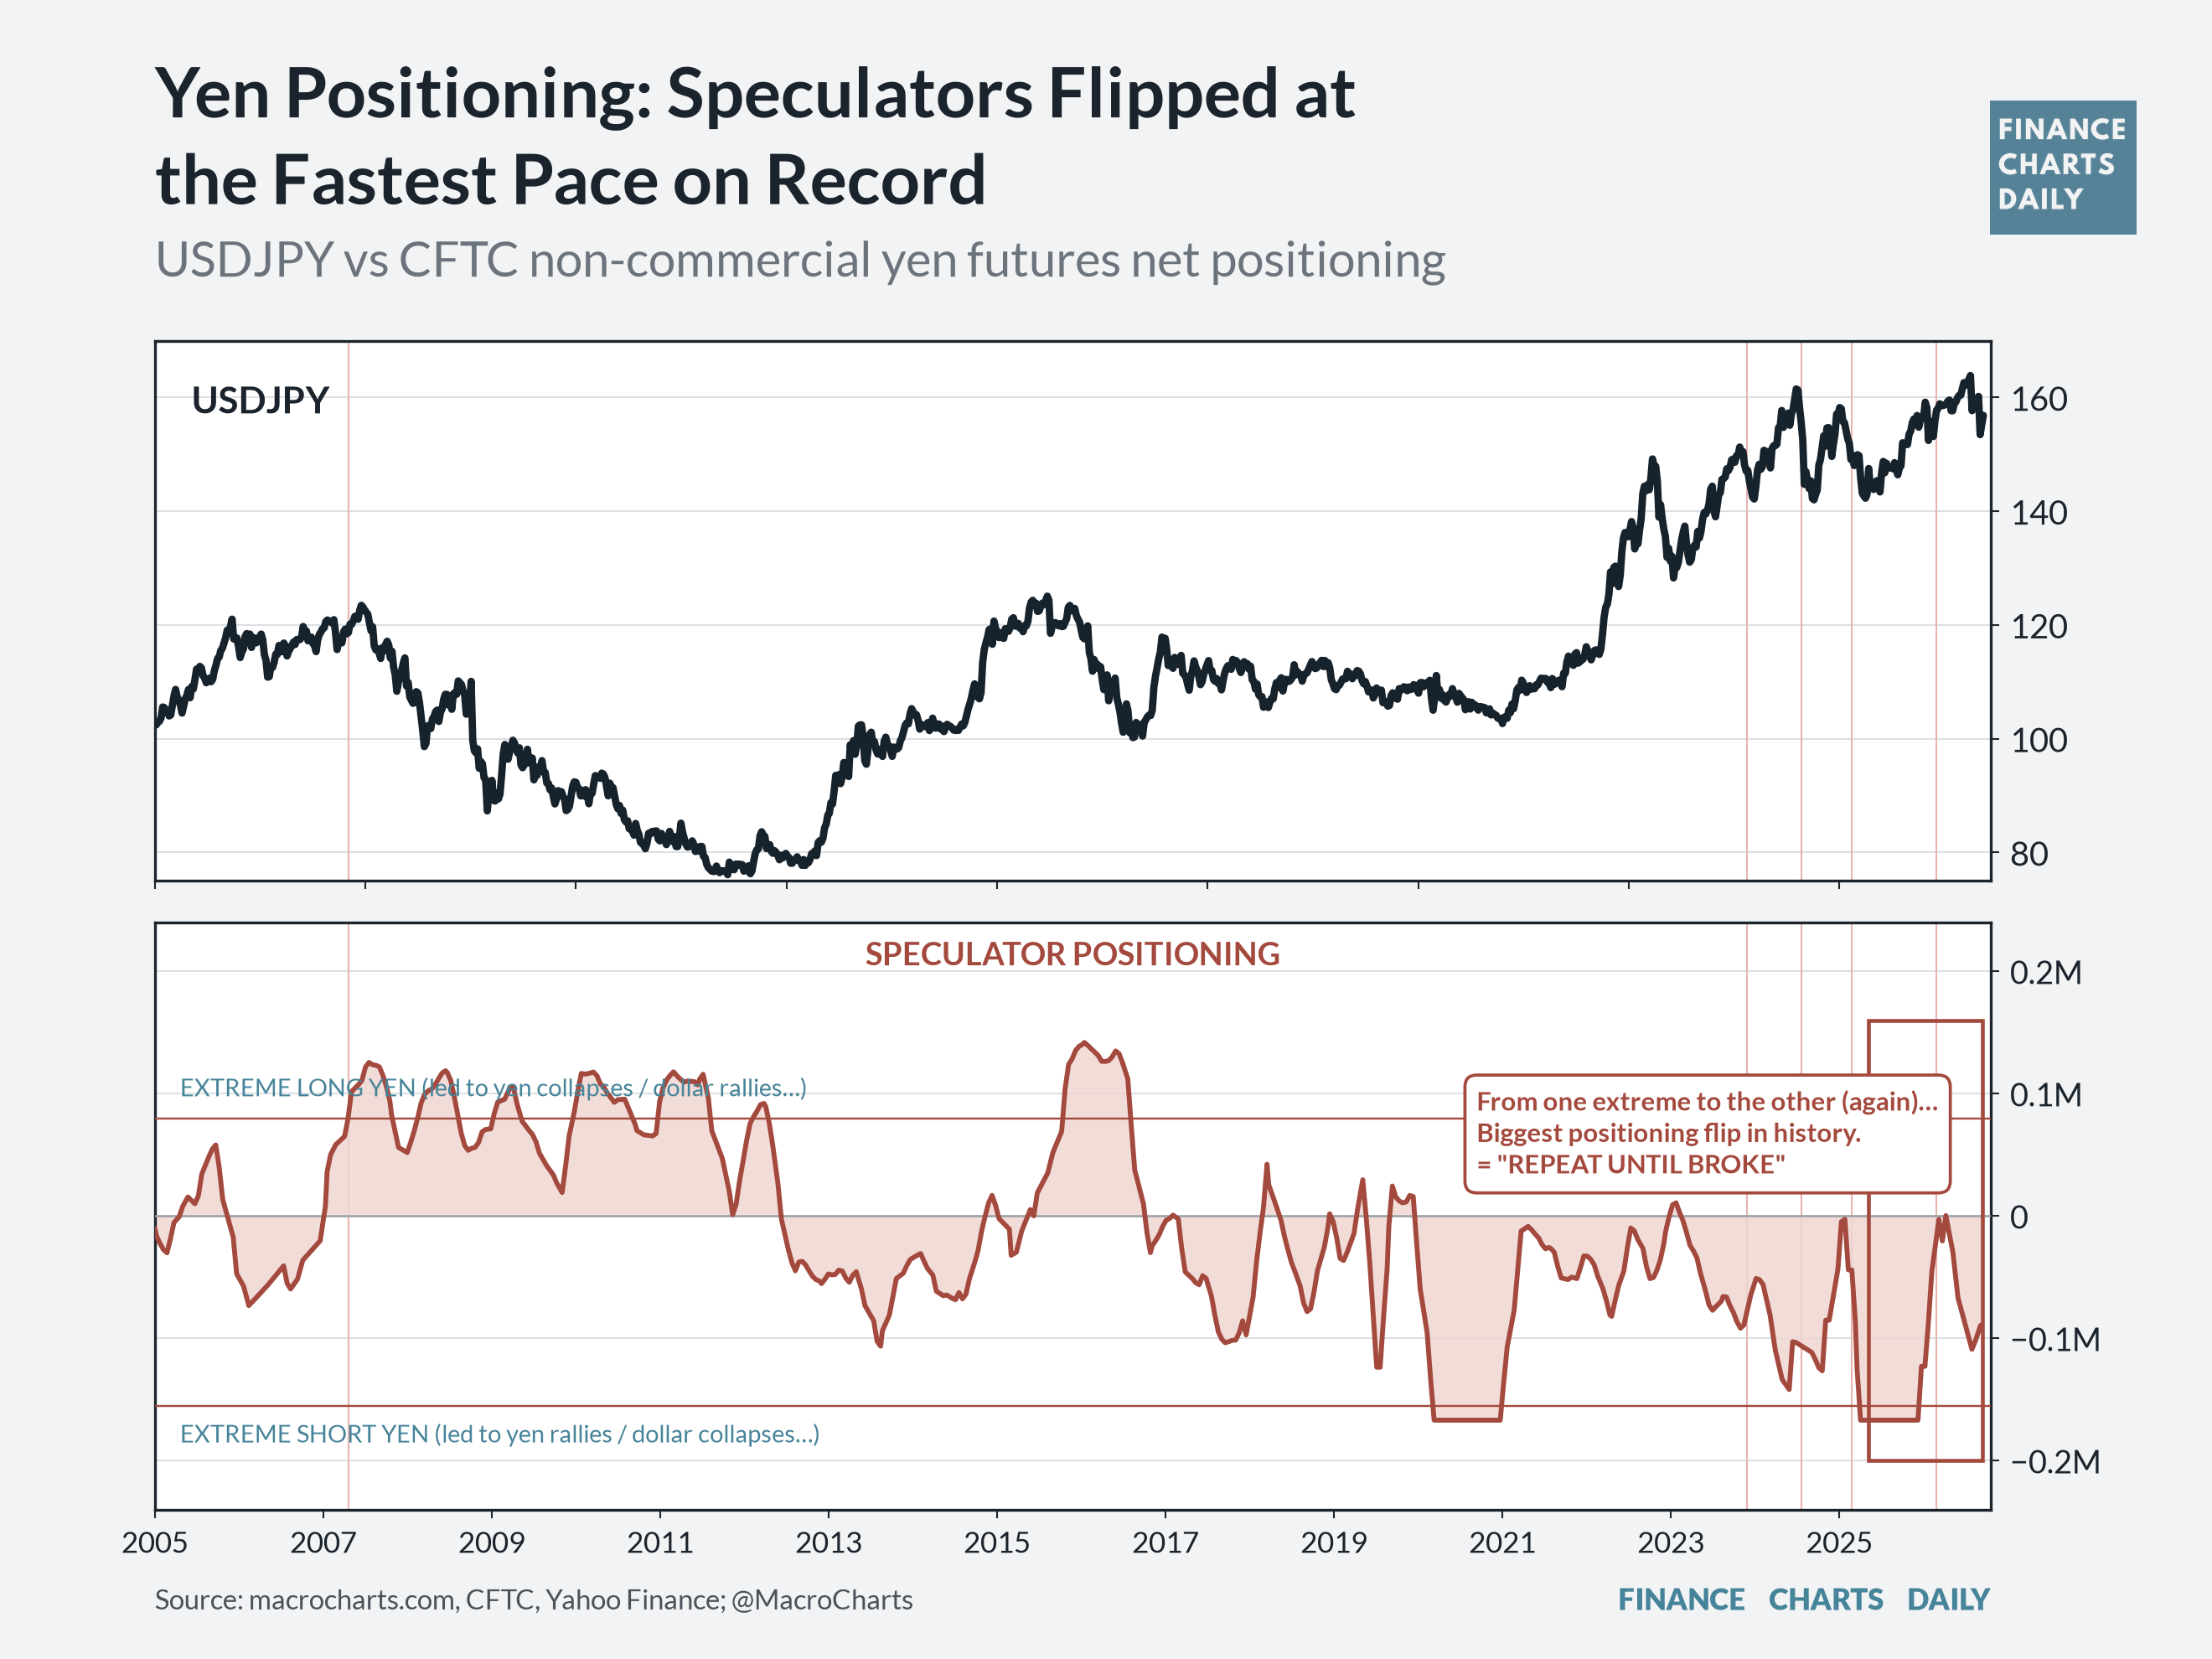
Yen positioning: Speculators just flipped yen exposure at the fastest pace on record.
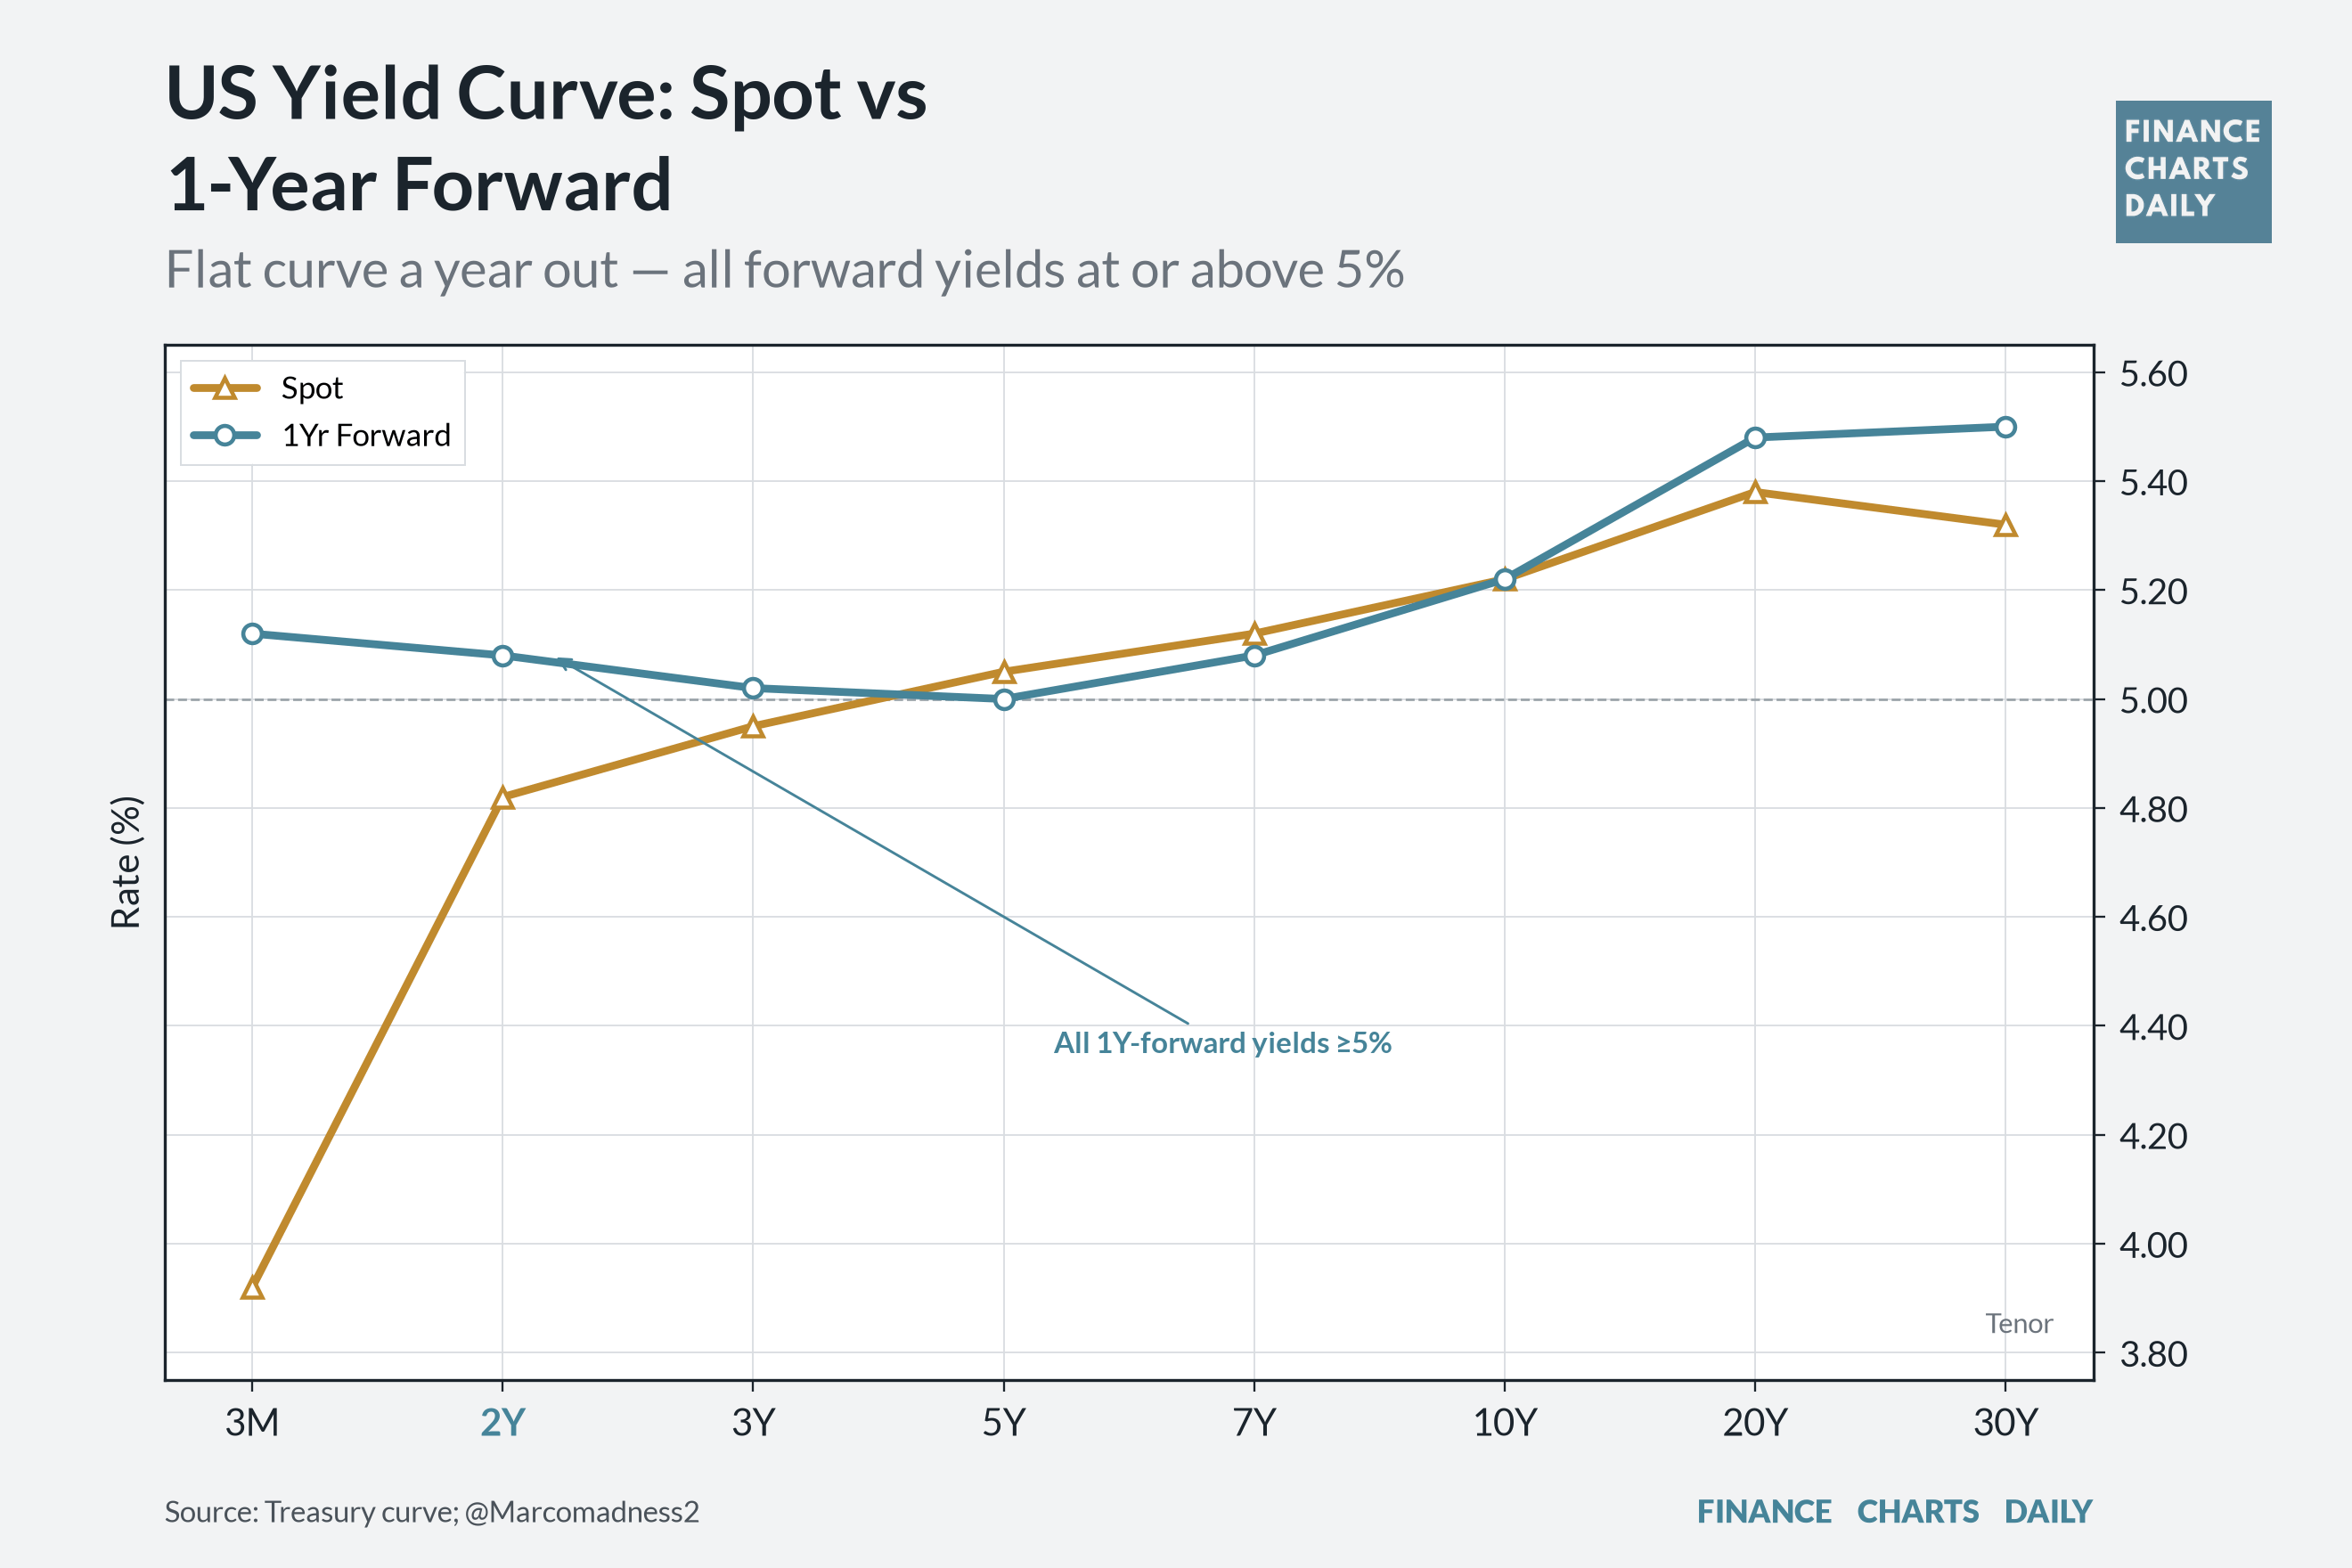
Yield curve: Markets price a flat curve a year out, with all yields at or above 5%.
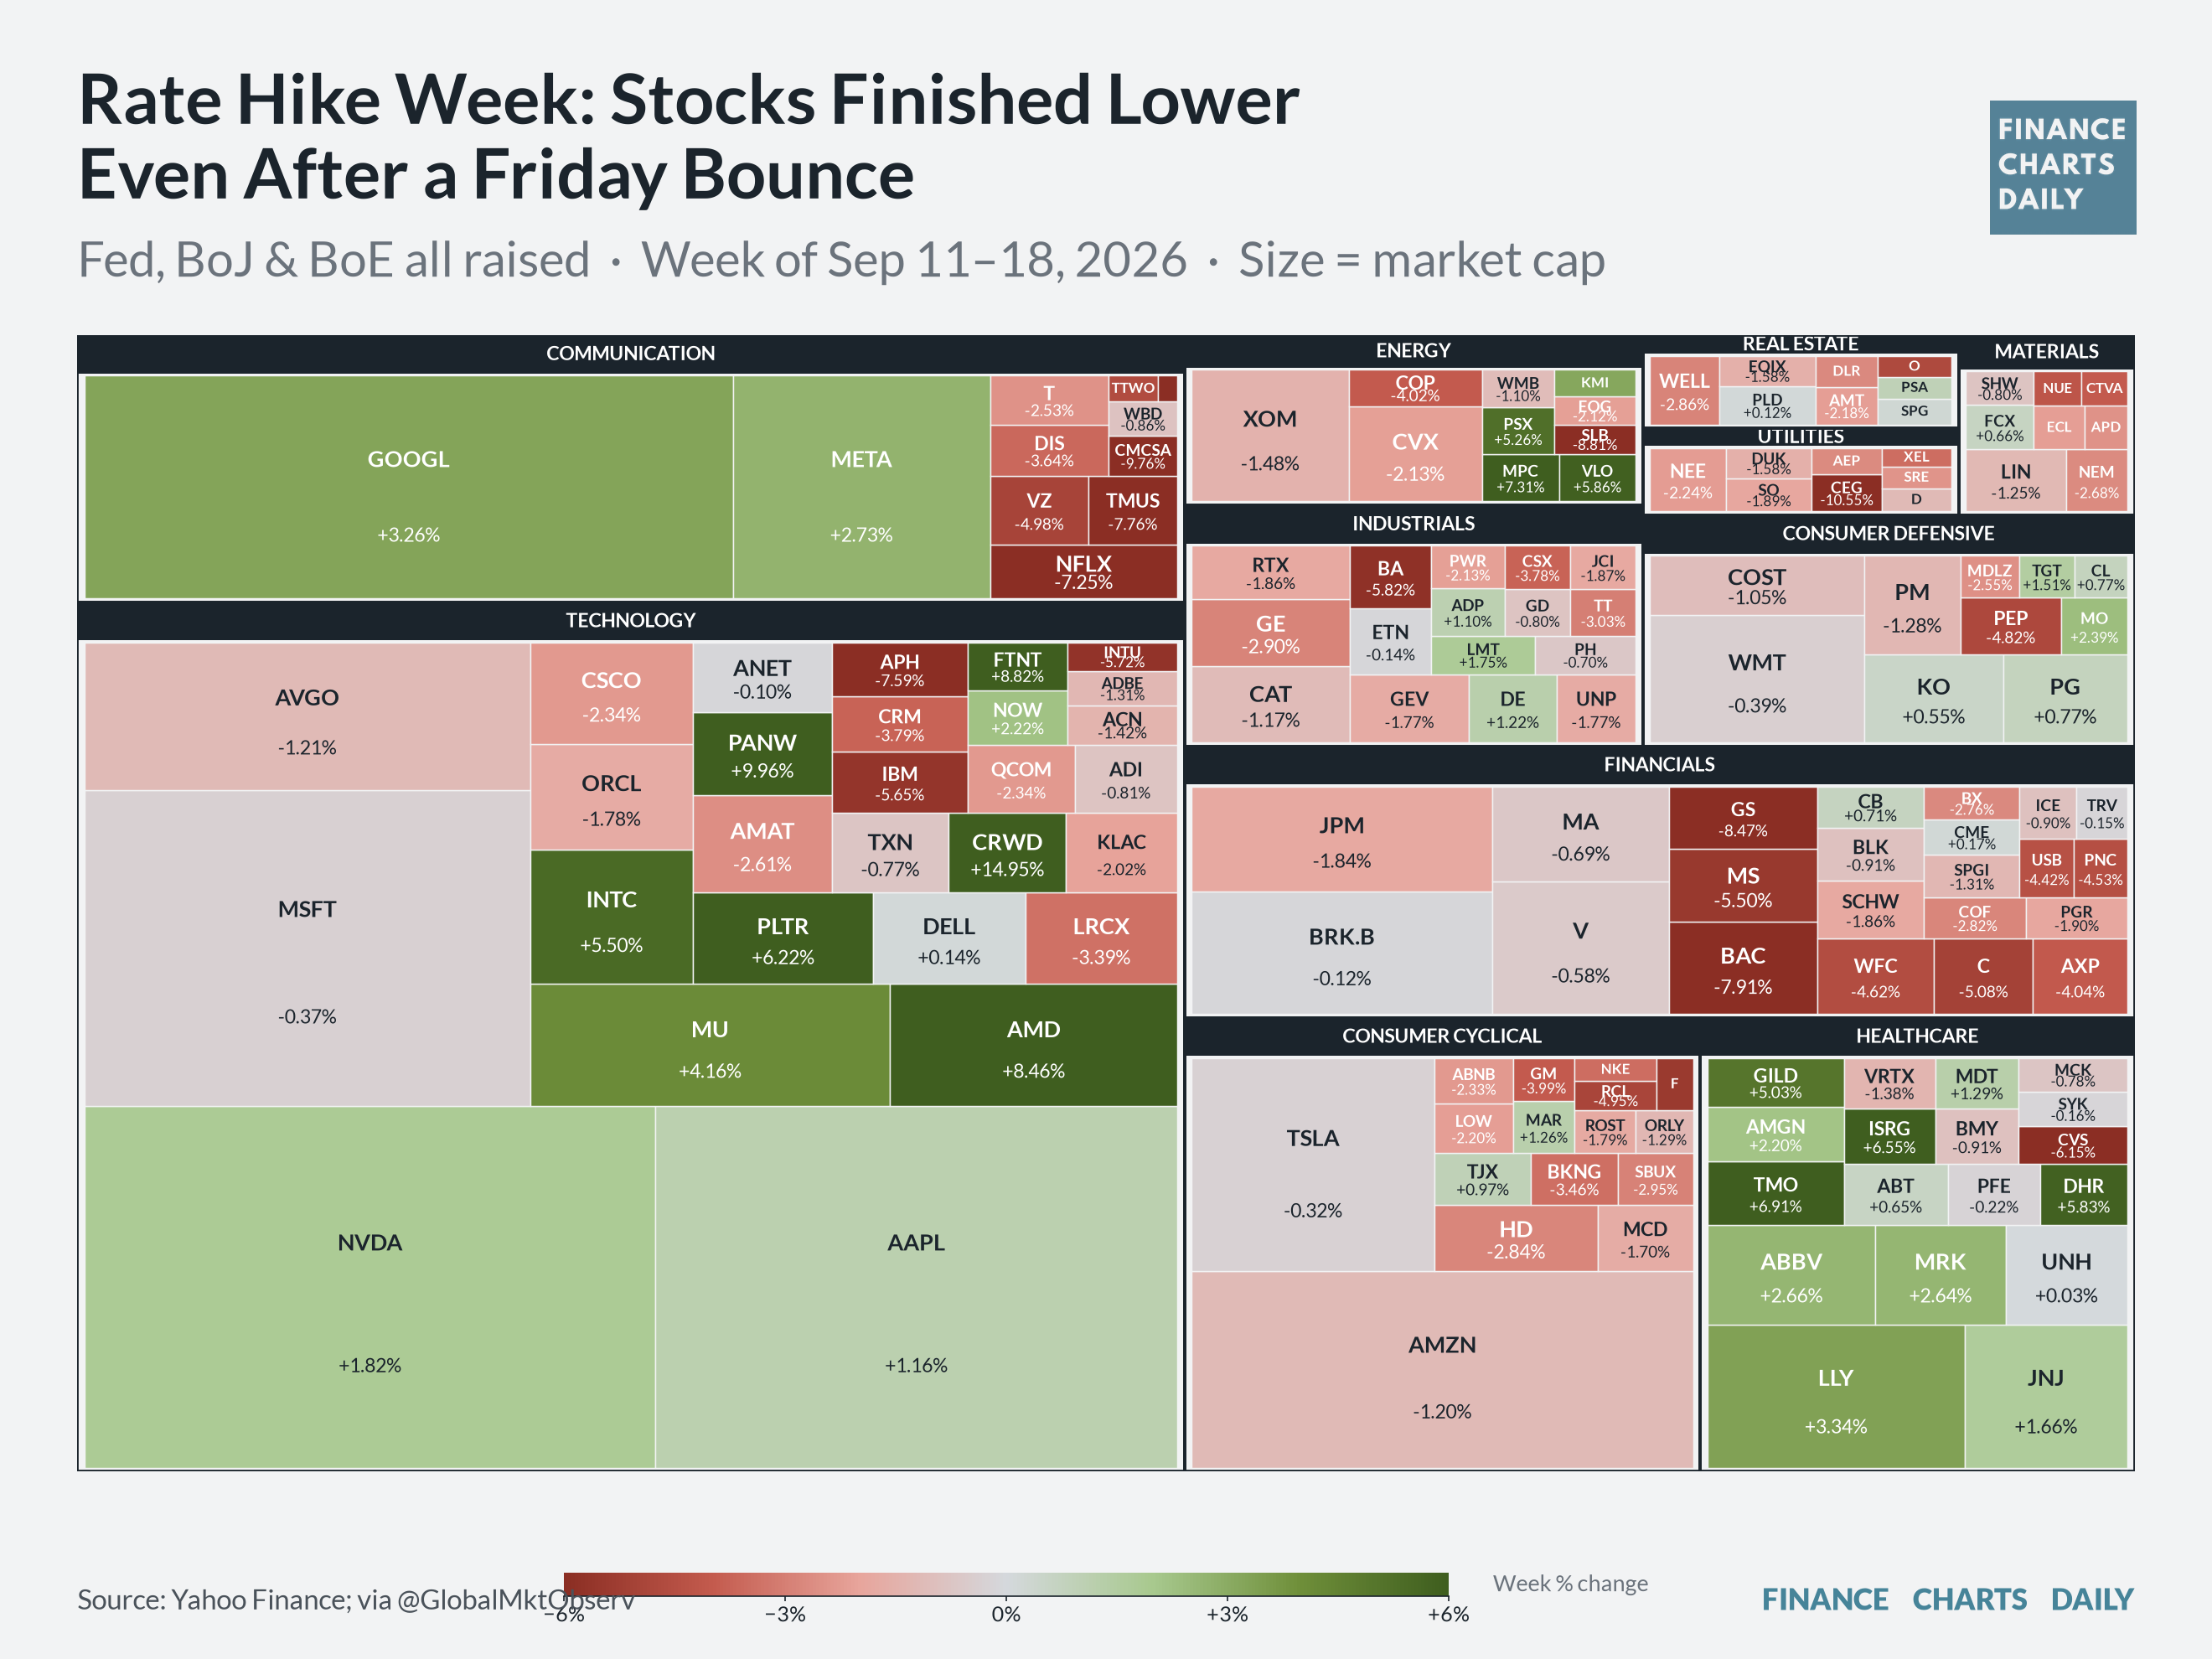
Rate hike week: Stocks finished lower even after a Friday bounce as the Fed, BoJ, and BoE all raised rates.
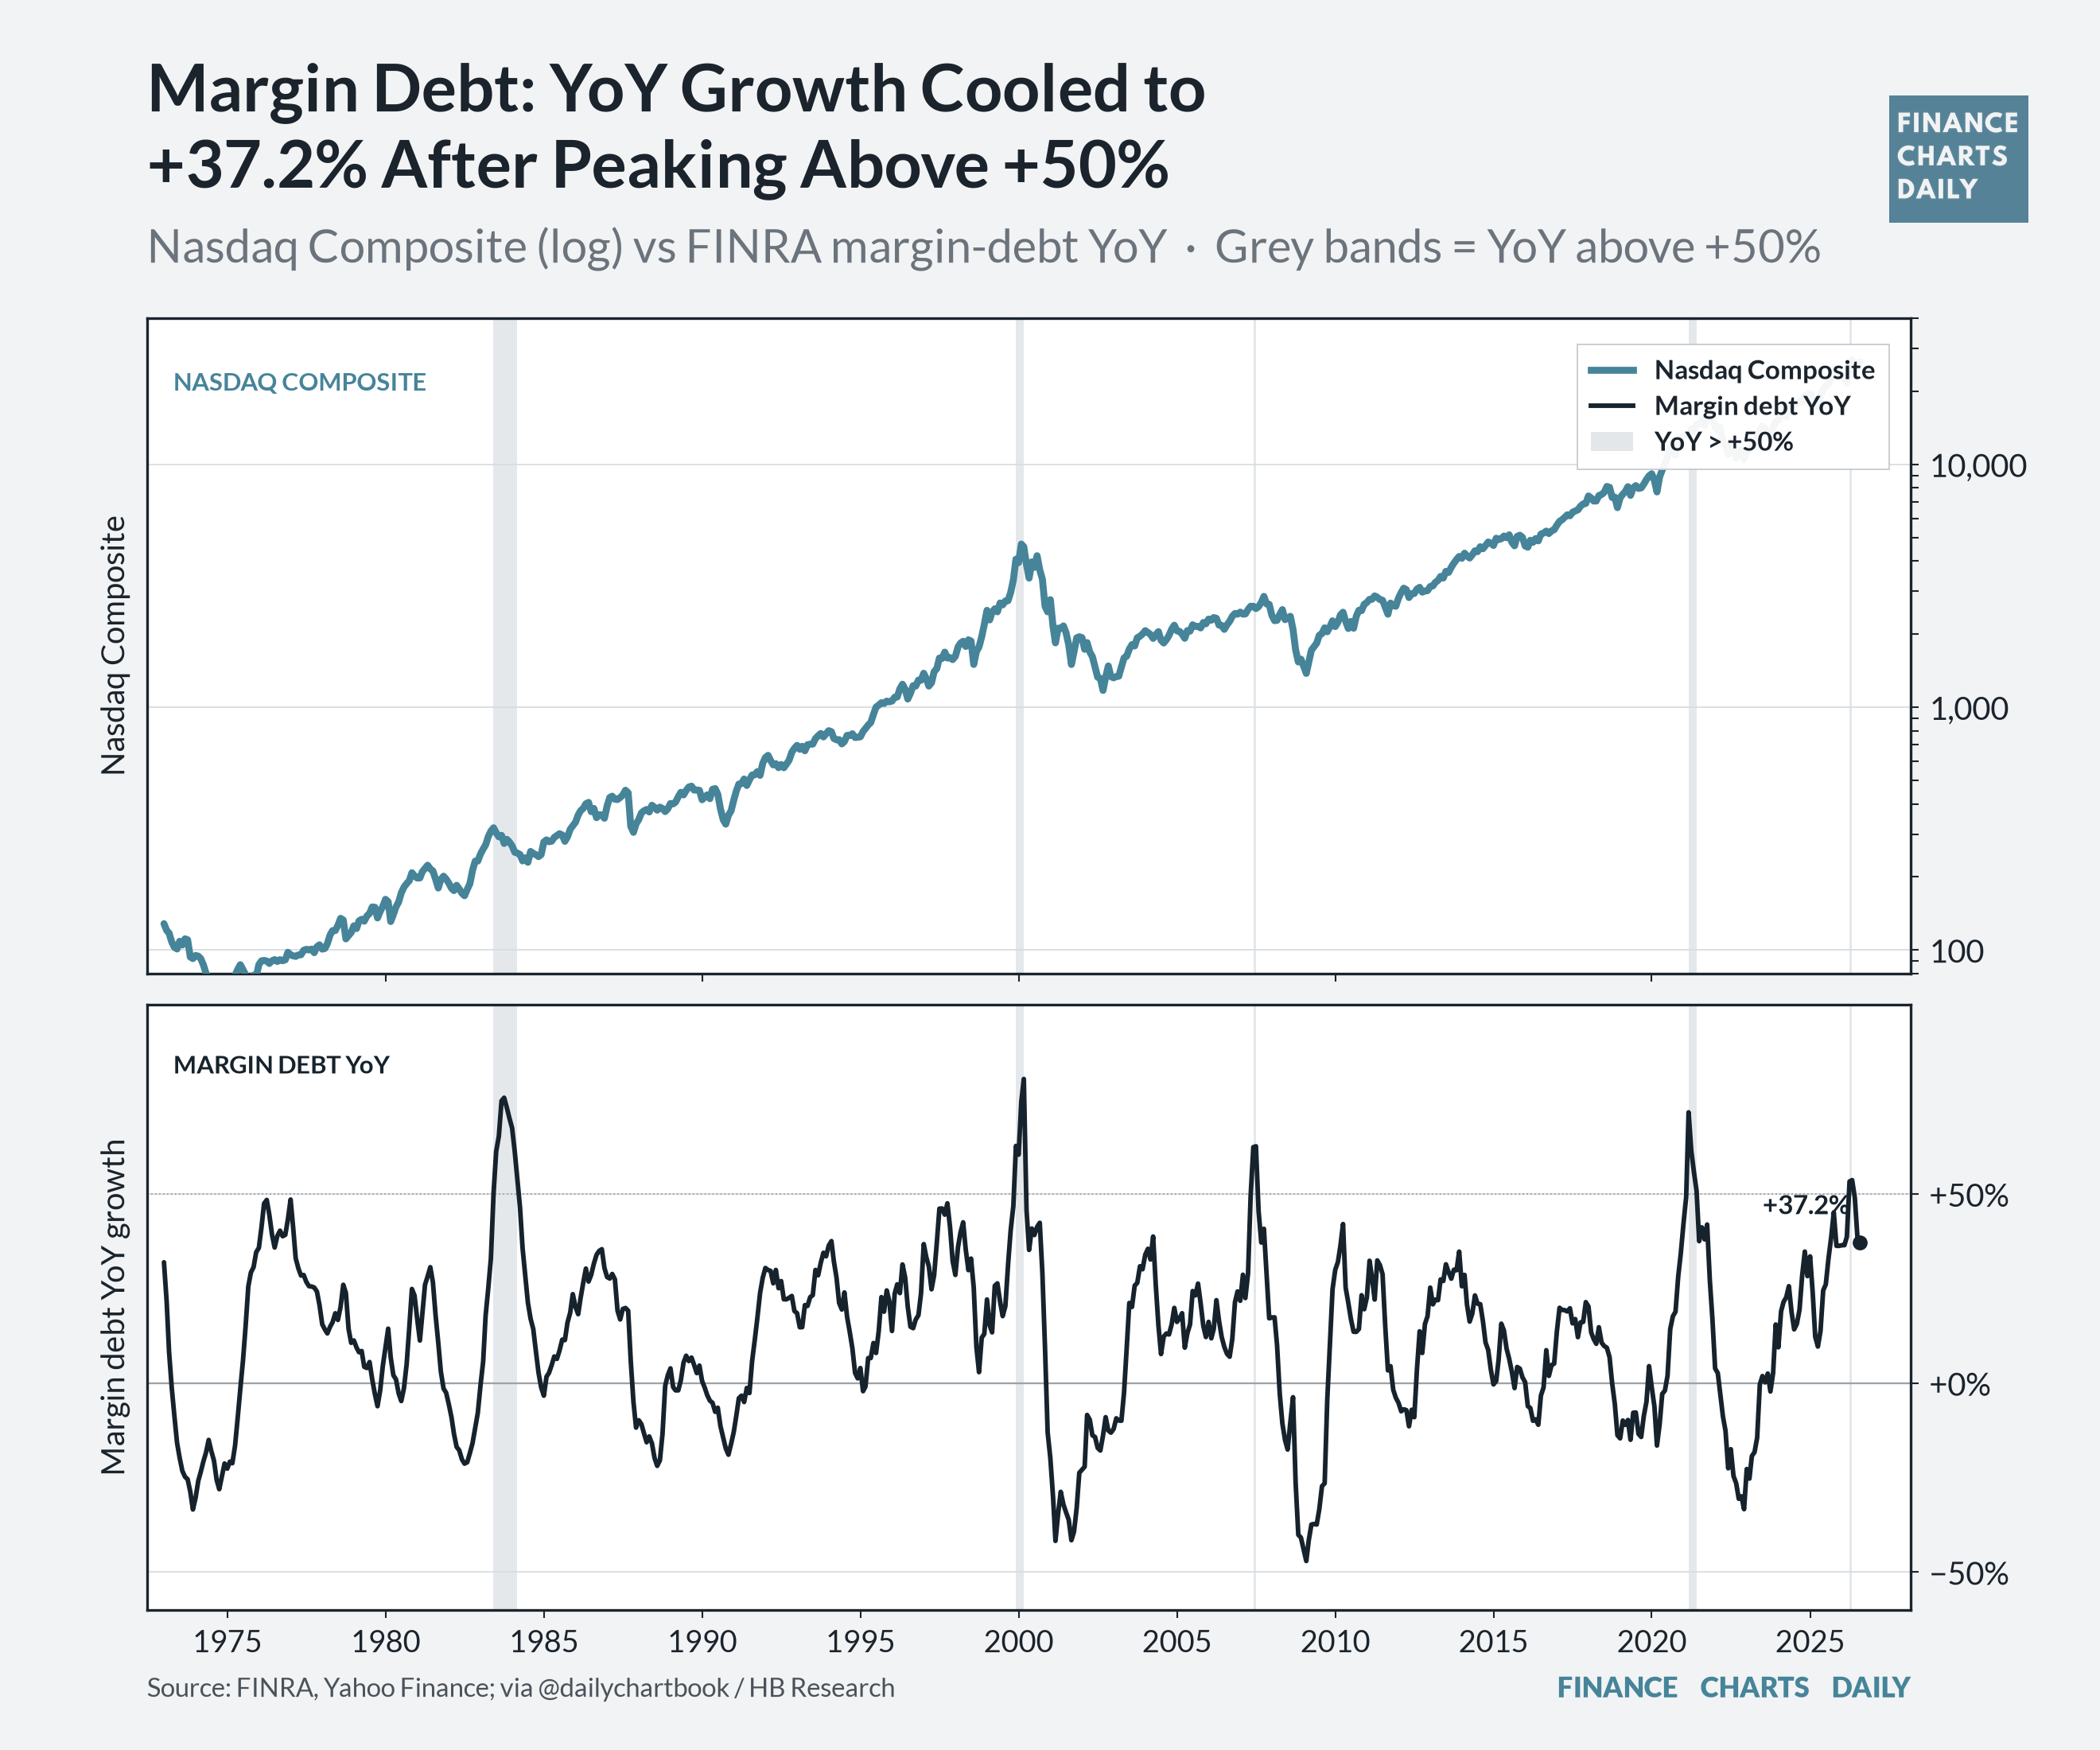
Margin debt: Margin-debt growth cooled to about +37% YoY after peaking above +50%.
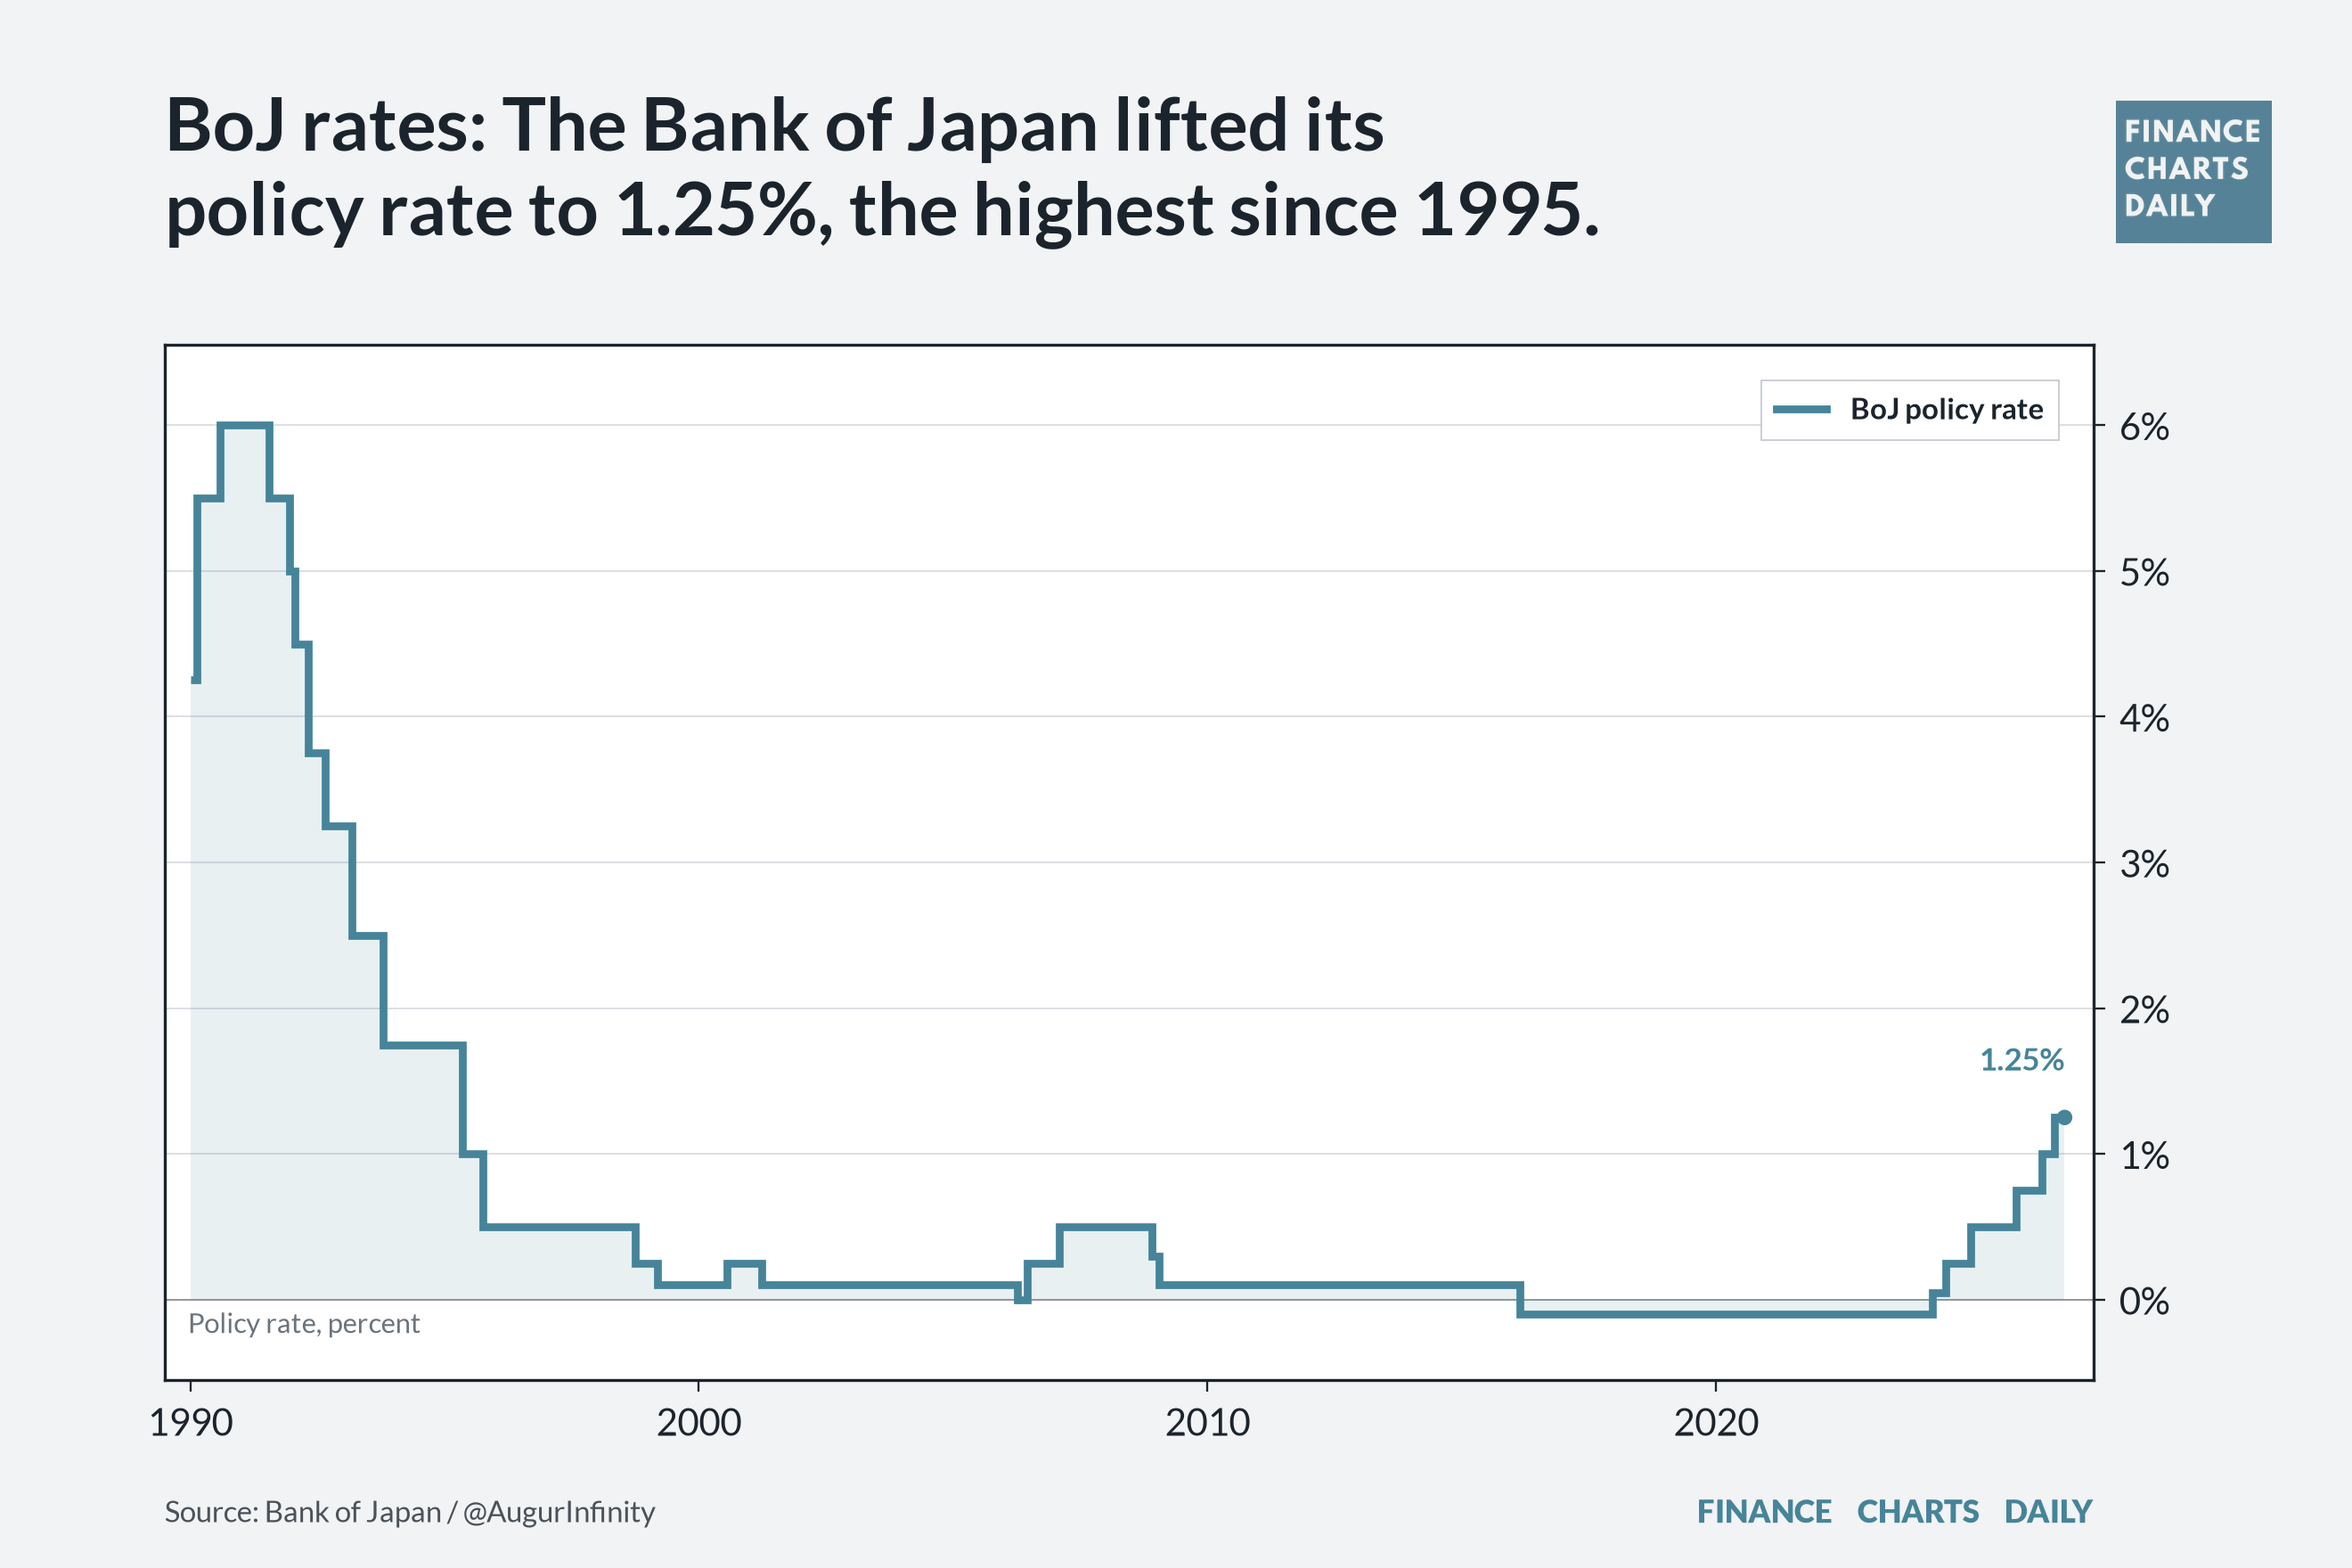
BoJ rates: The Bank of Japan lifted its policy rate to 1.25%, the highest since 1995.