Finance Charts Daily

Finance Charts Daily

The S&P Is Near A High While Over 70% Of Its Stocks Sit At Least 10% Below Theirs

Finance Charts Daily's avatar
Finance Charts Daily
Sep 29, 2026
∙ Paid
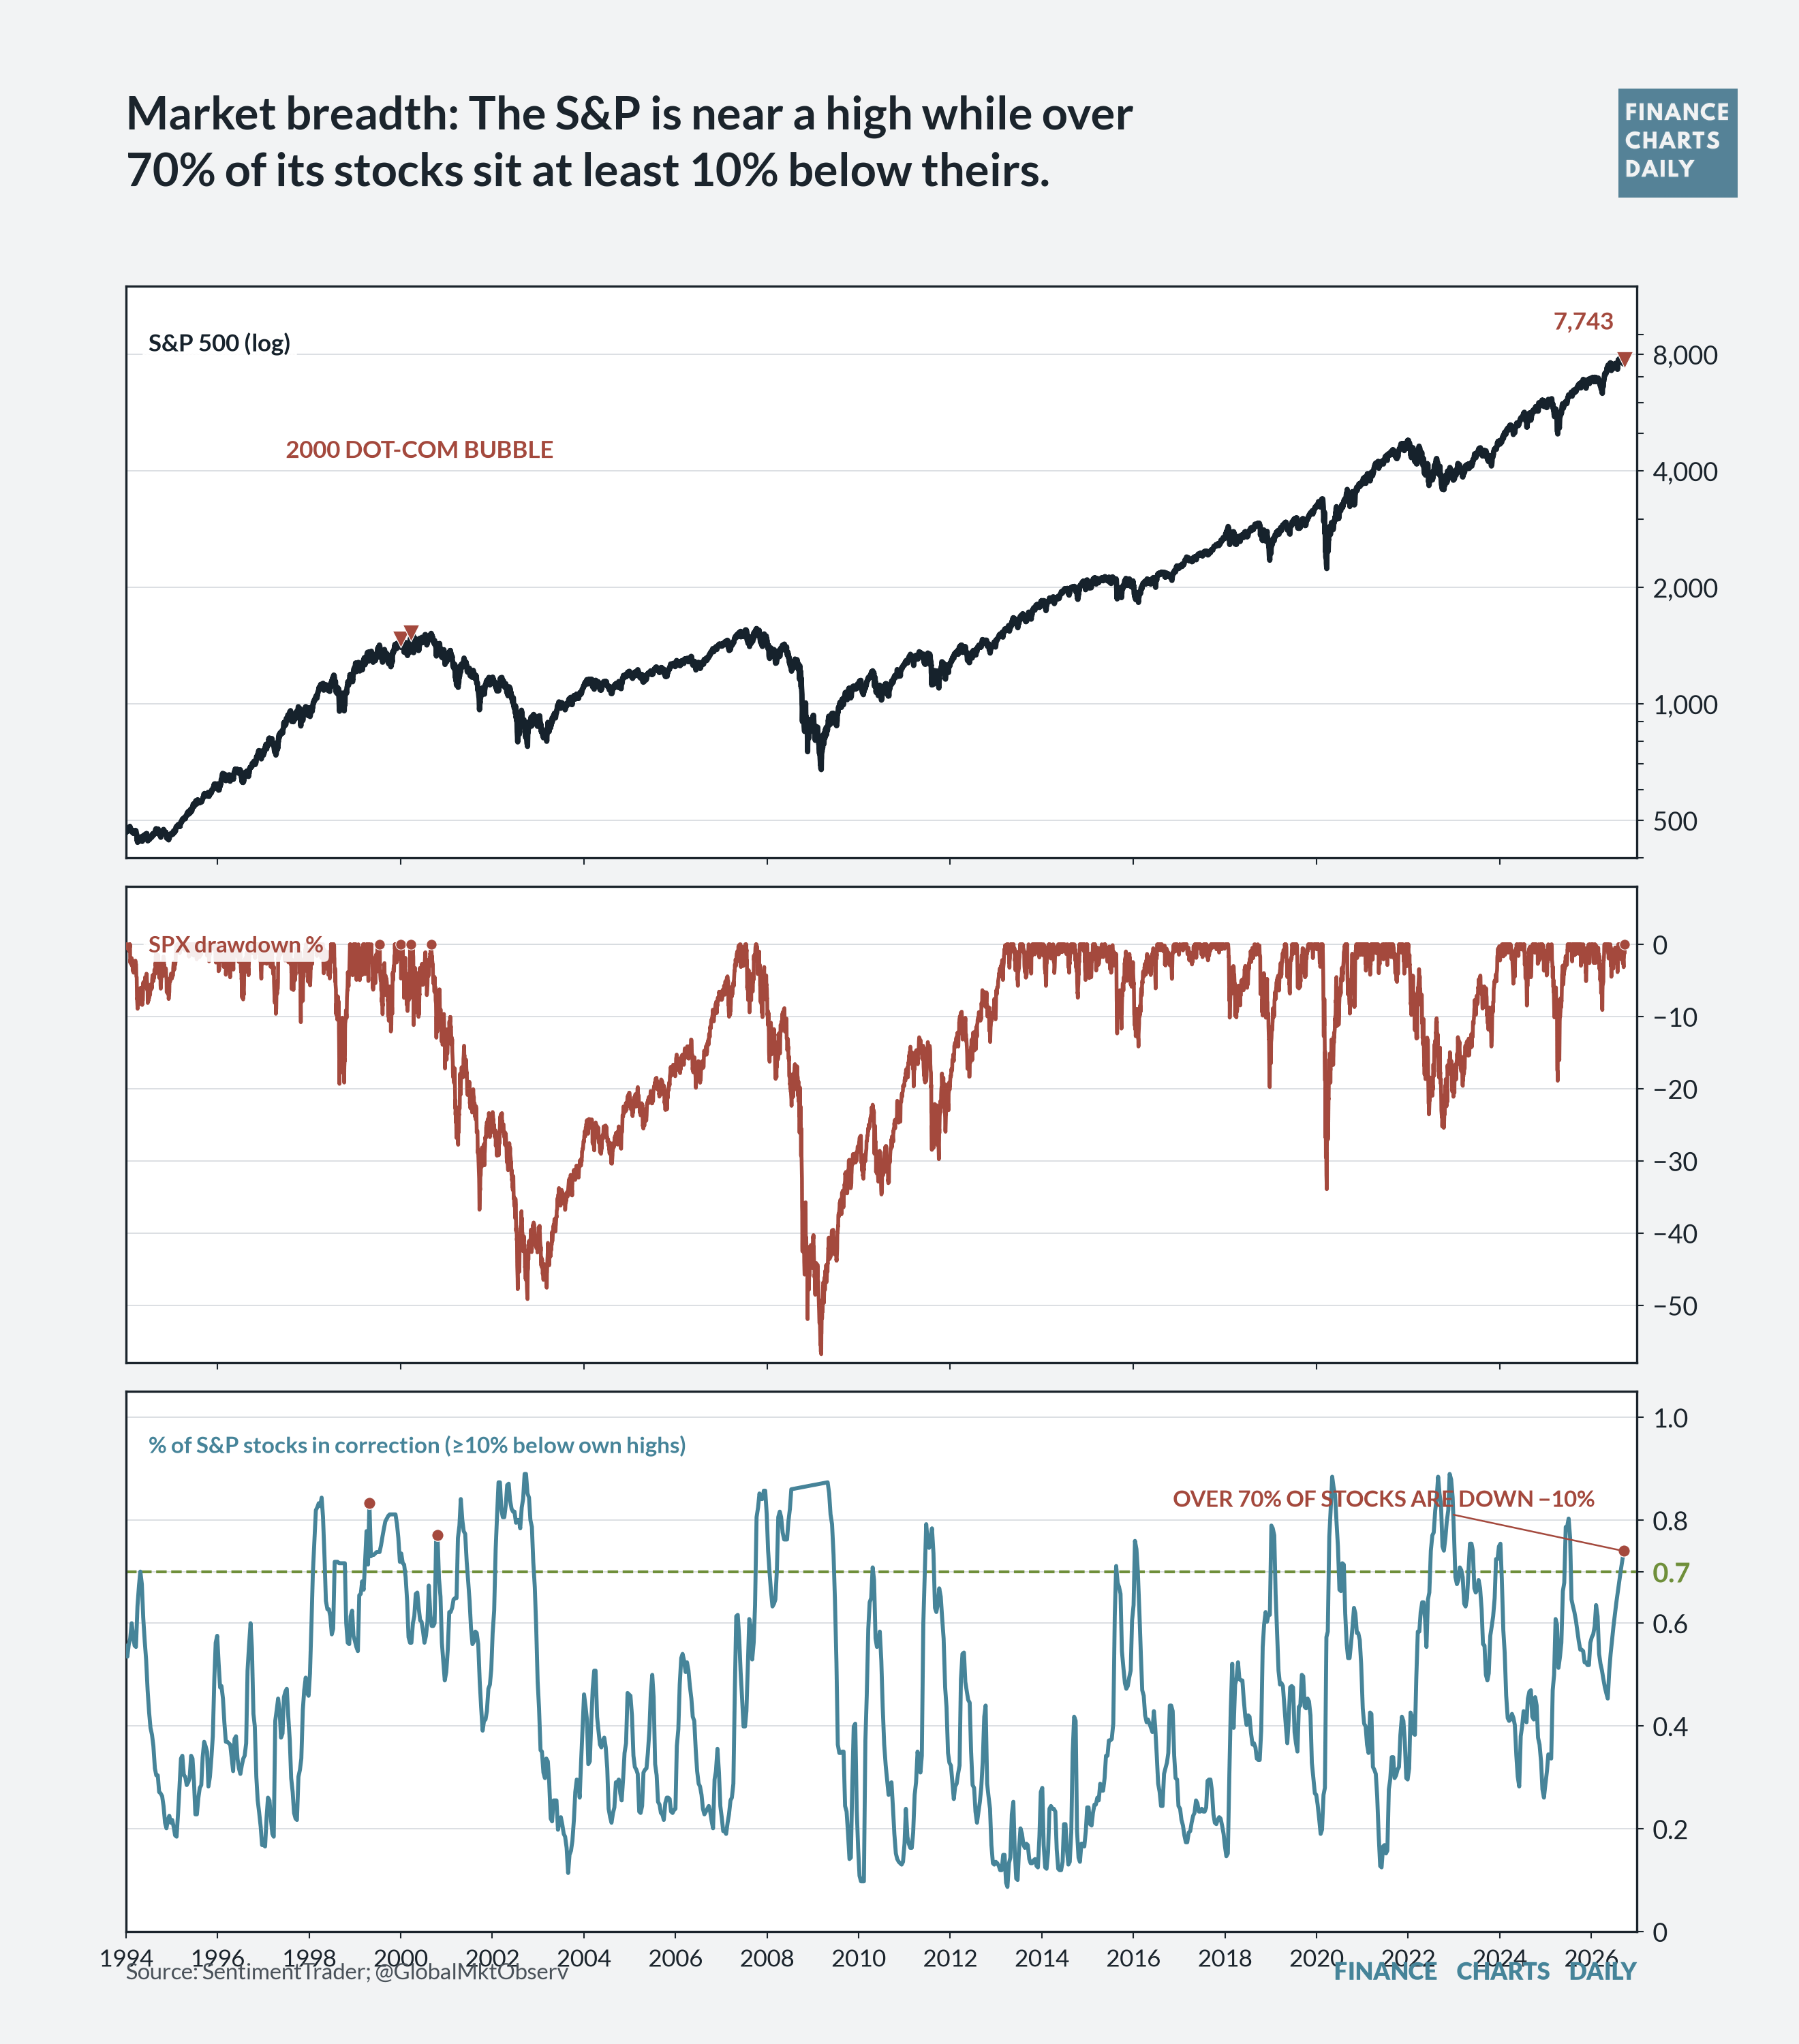
  1. Market breadth: The S&P is near a high while over 70% of its stocks sit at least 10% below theirs.
Global Markets Observer


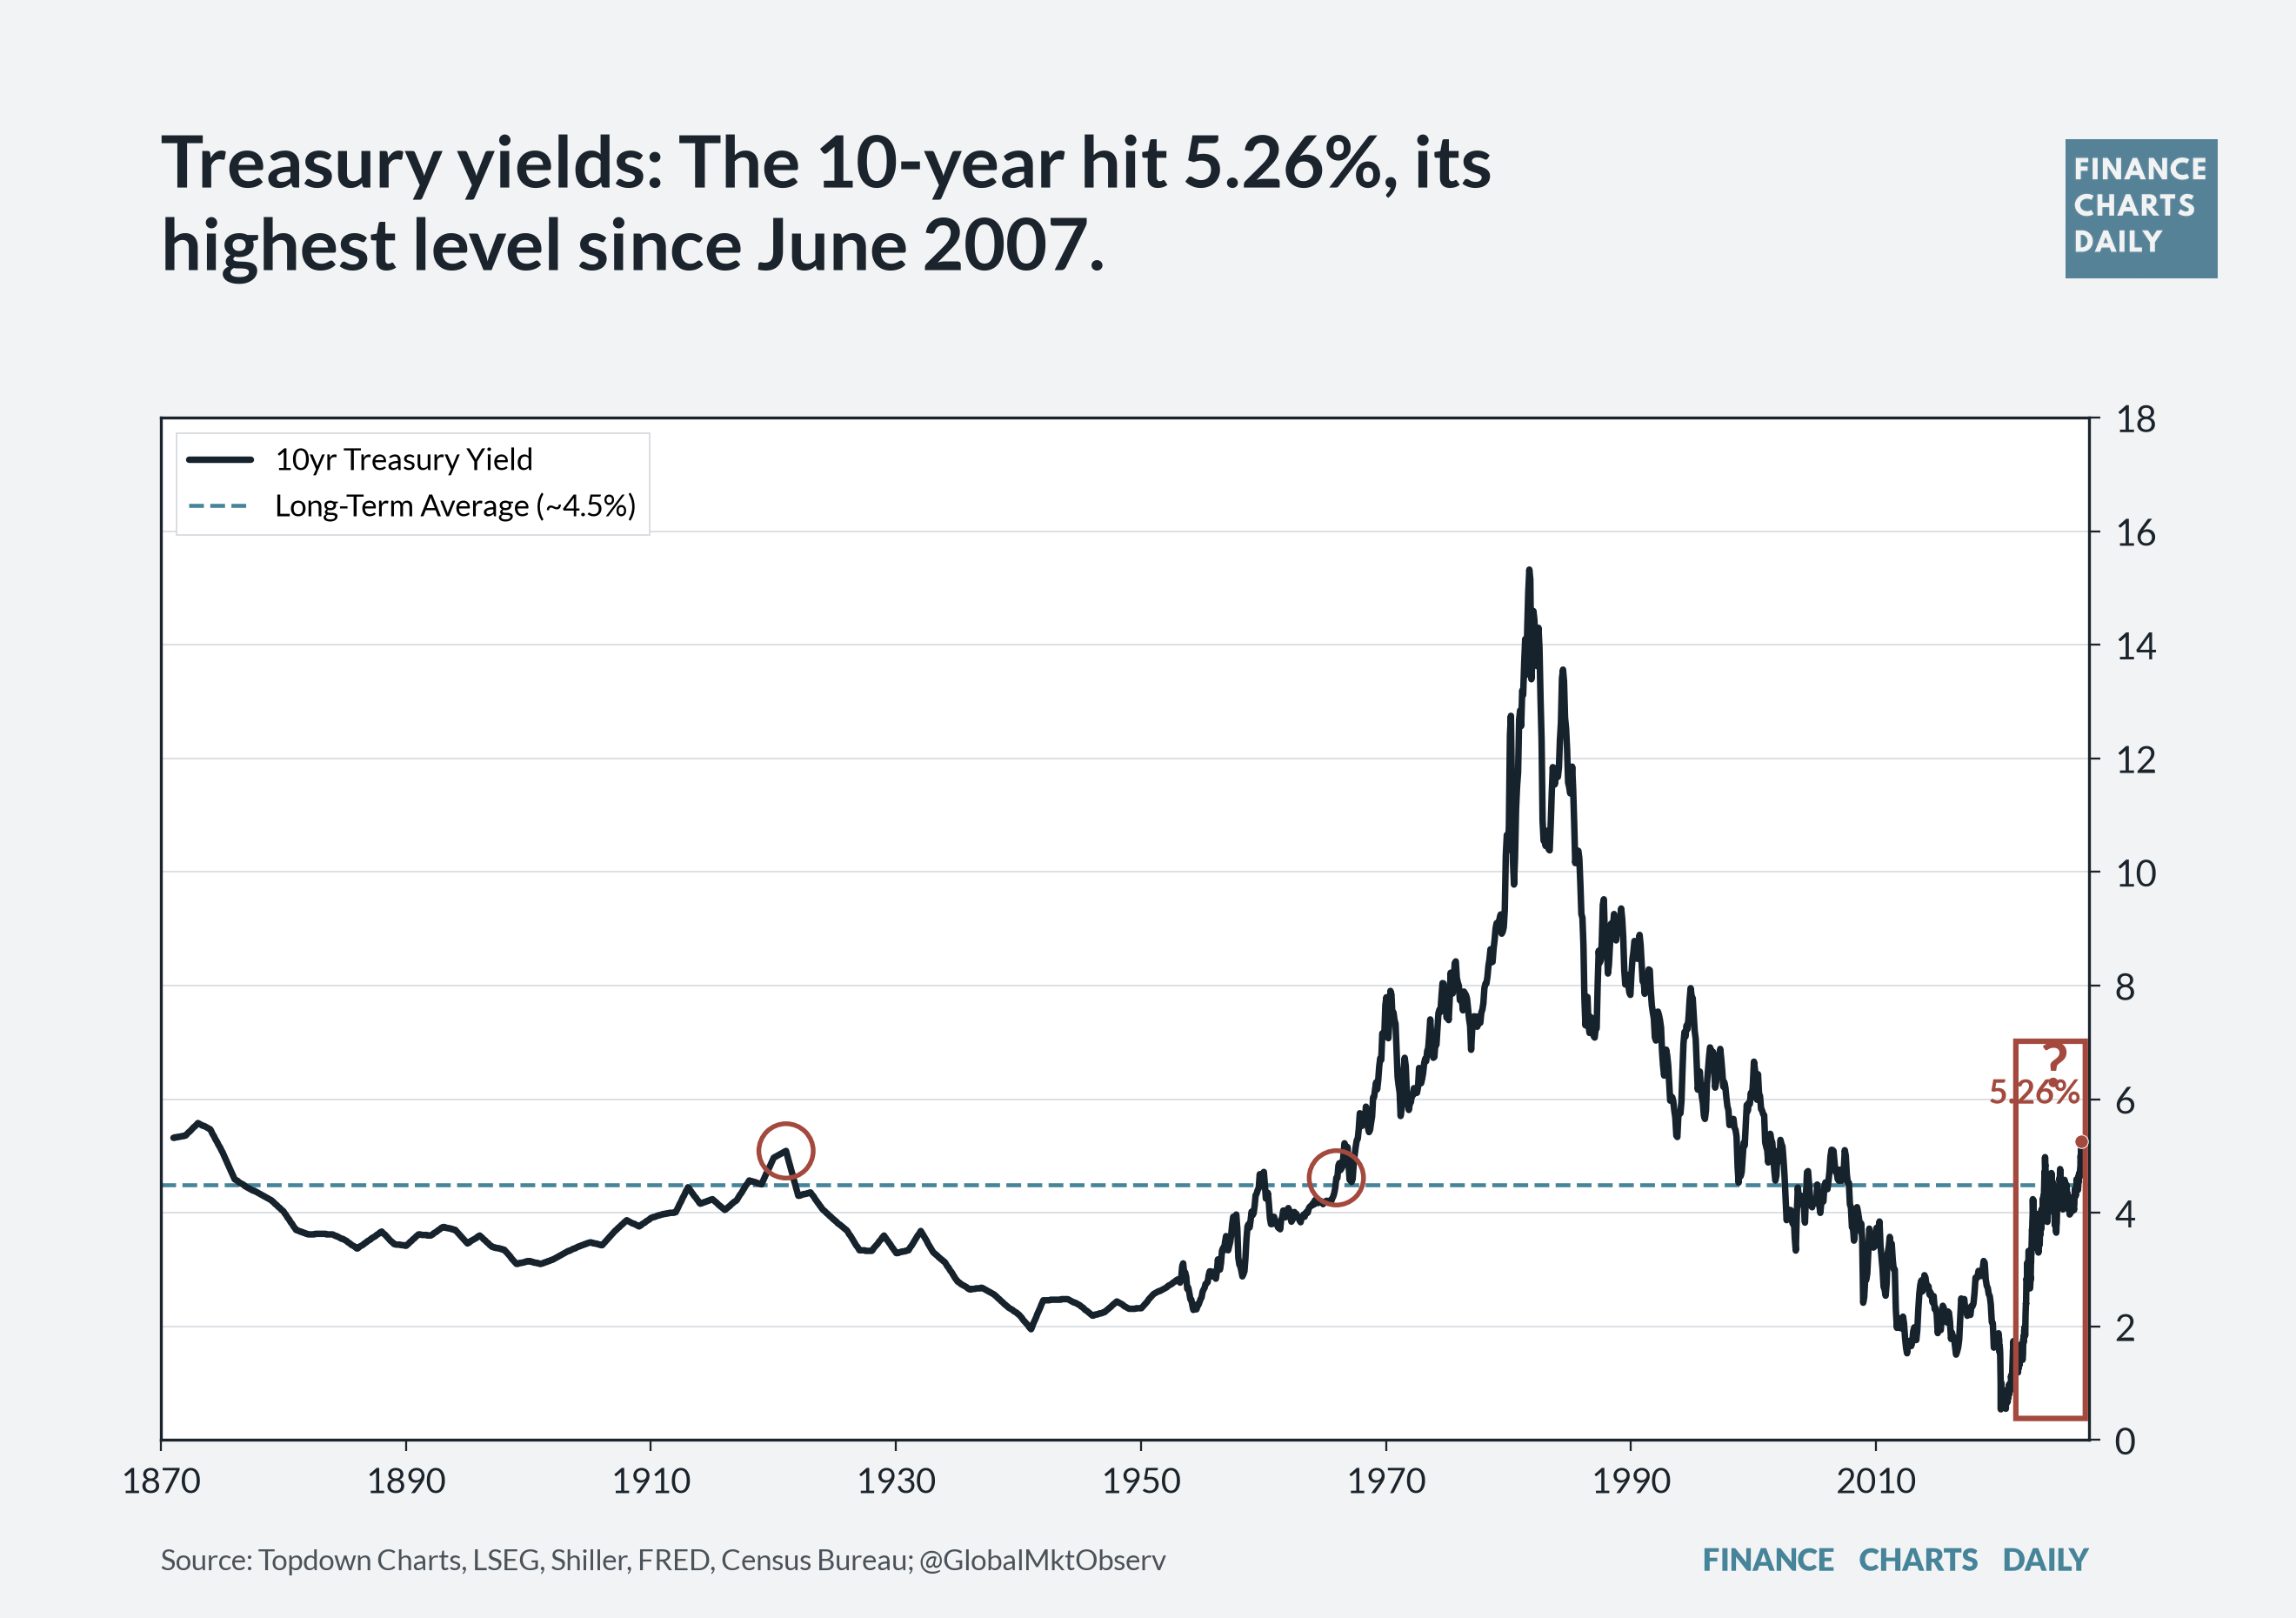
  1. Treasury yields: The 10-year hit 5.26%, its highest level since June 2007.
Global Markets Observer


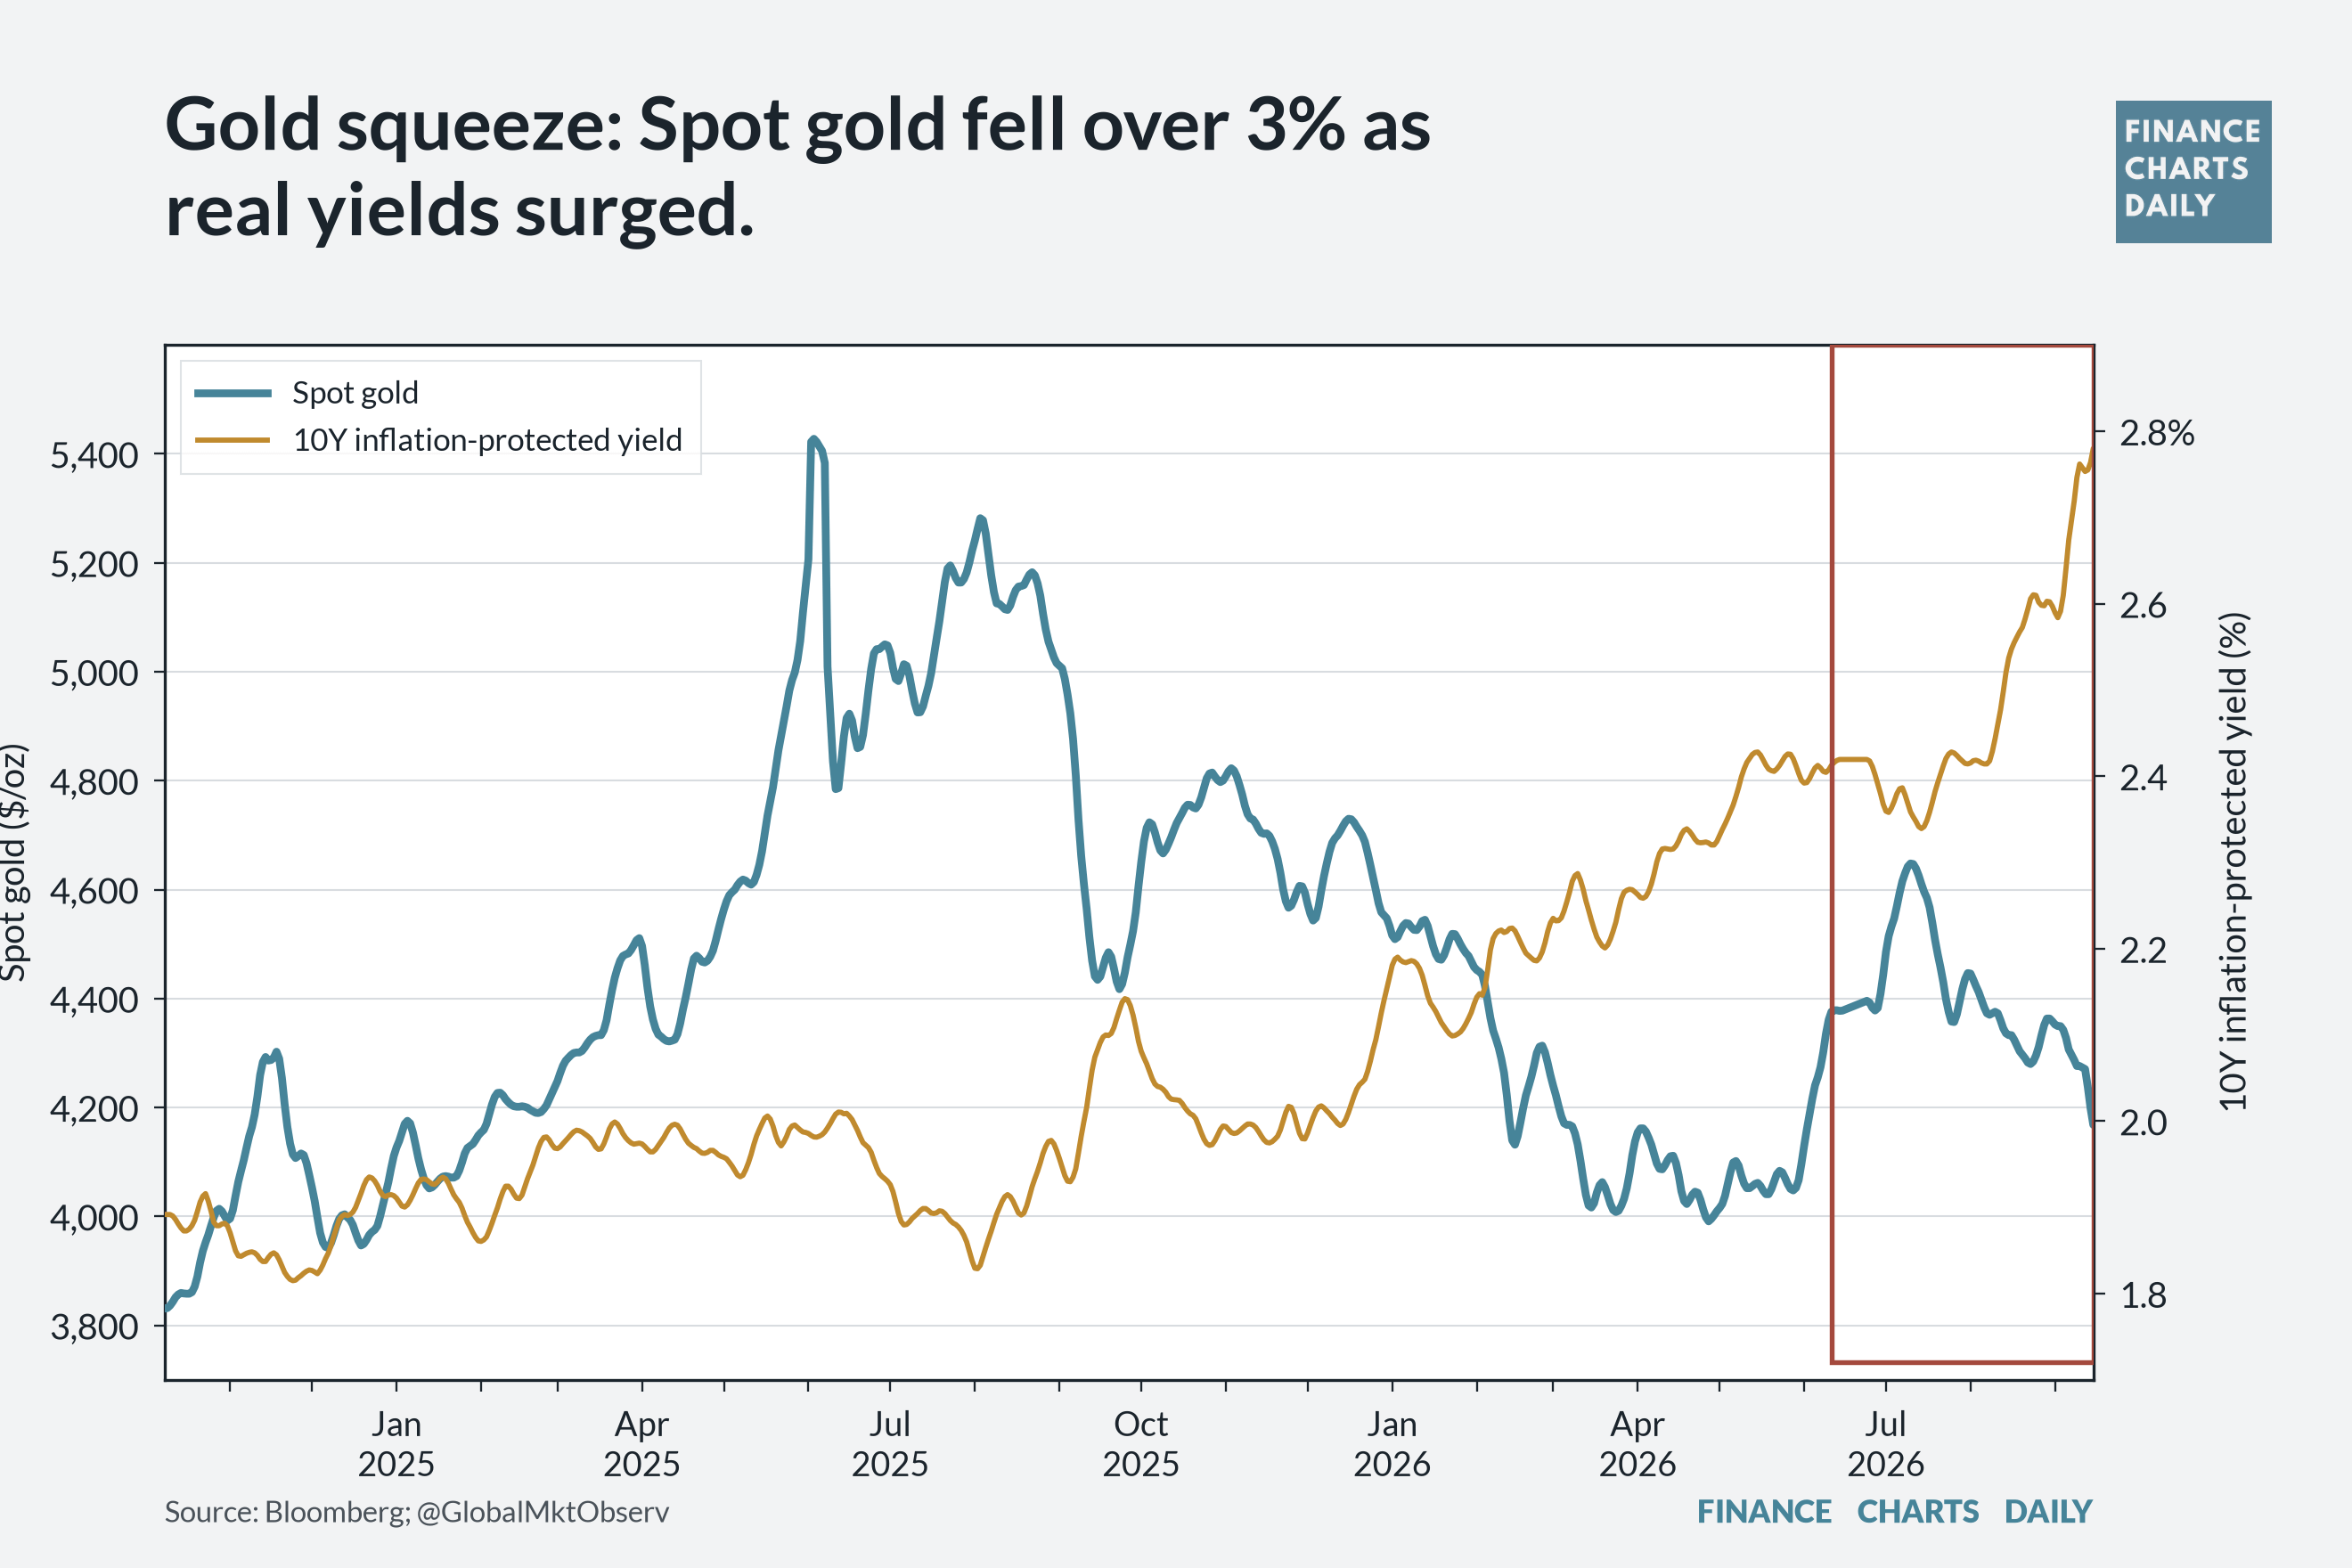
  1. Gold squeeze: Spot gold fell over 3% as real yields surged.
Global Markets Observer


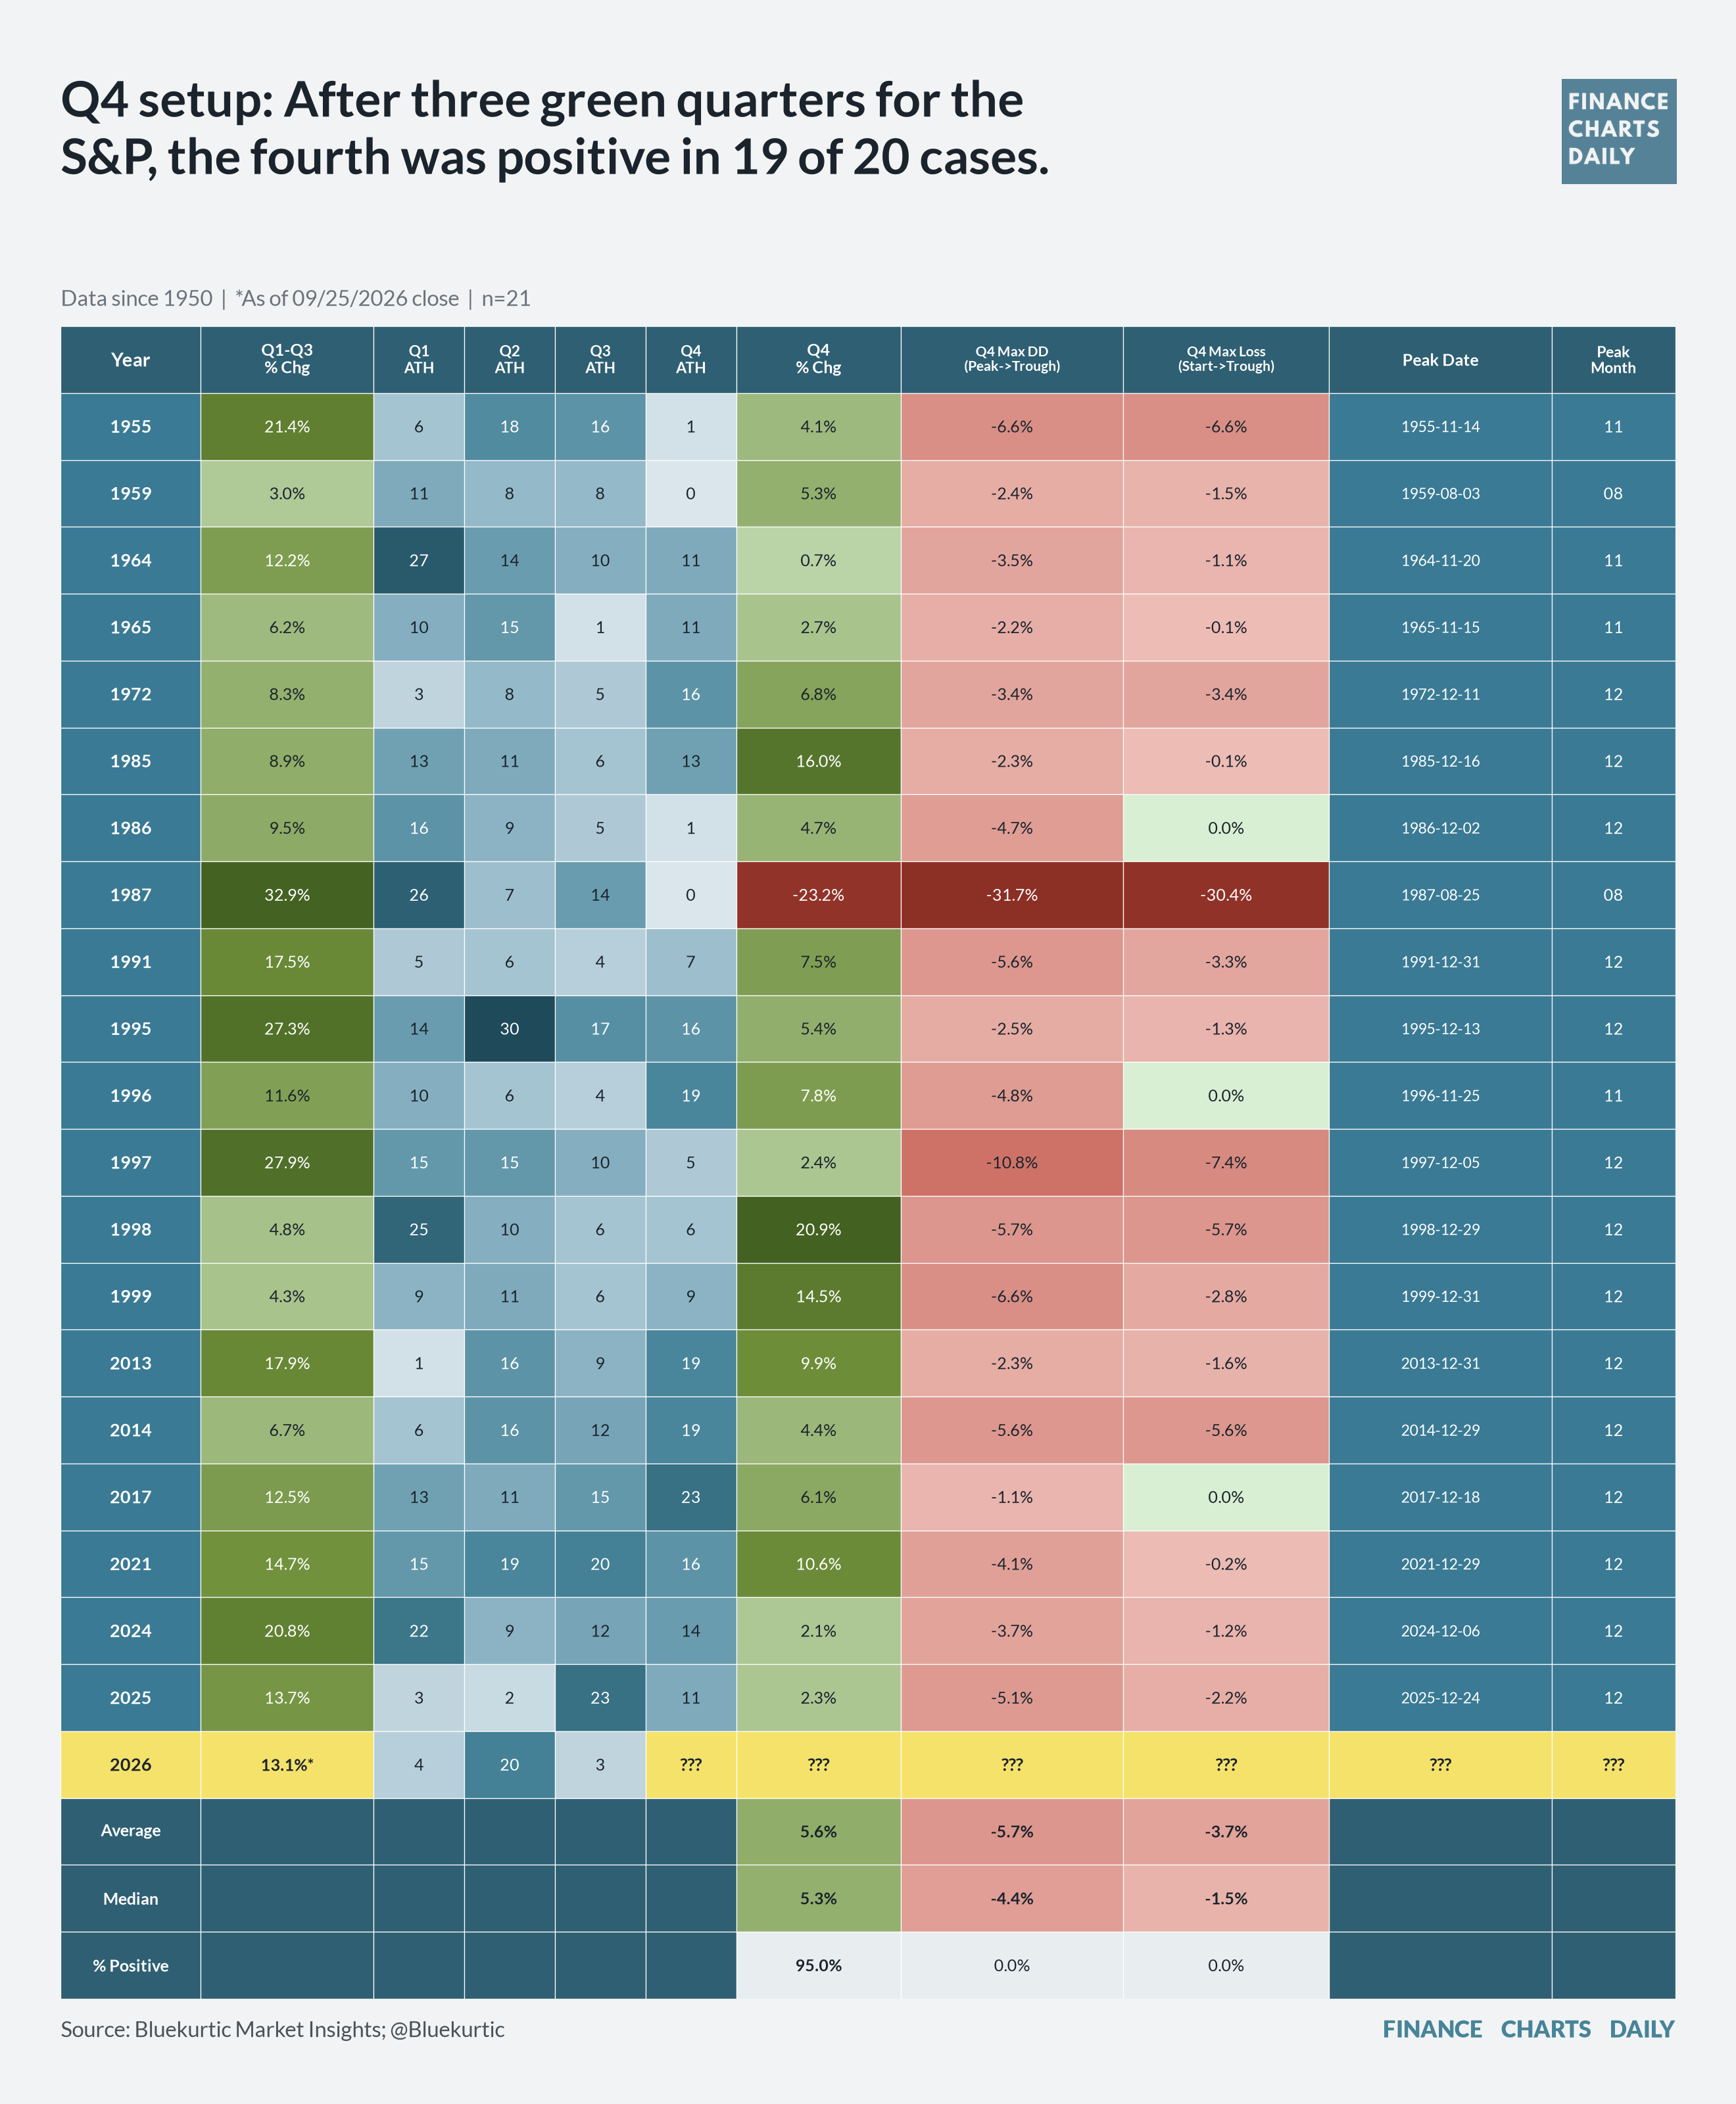
  1. Q4 setup: After three green quarters for the S&P, the fourth was positive in 19 of 20 cases.
Bluekurtic


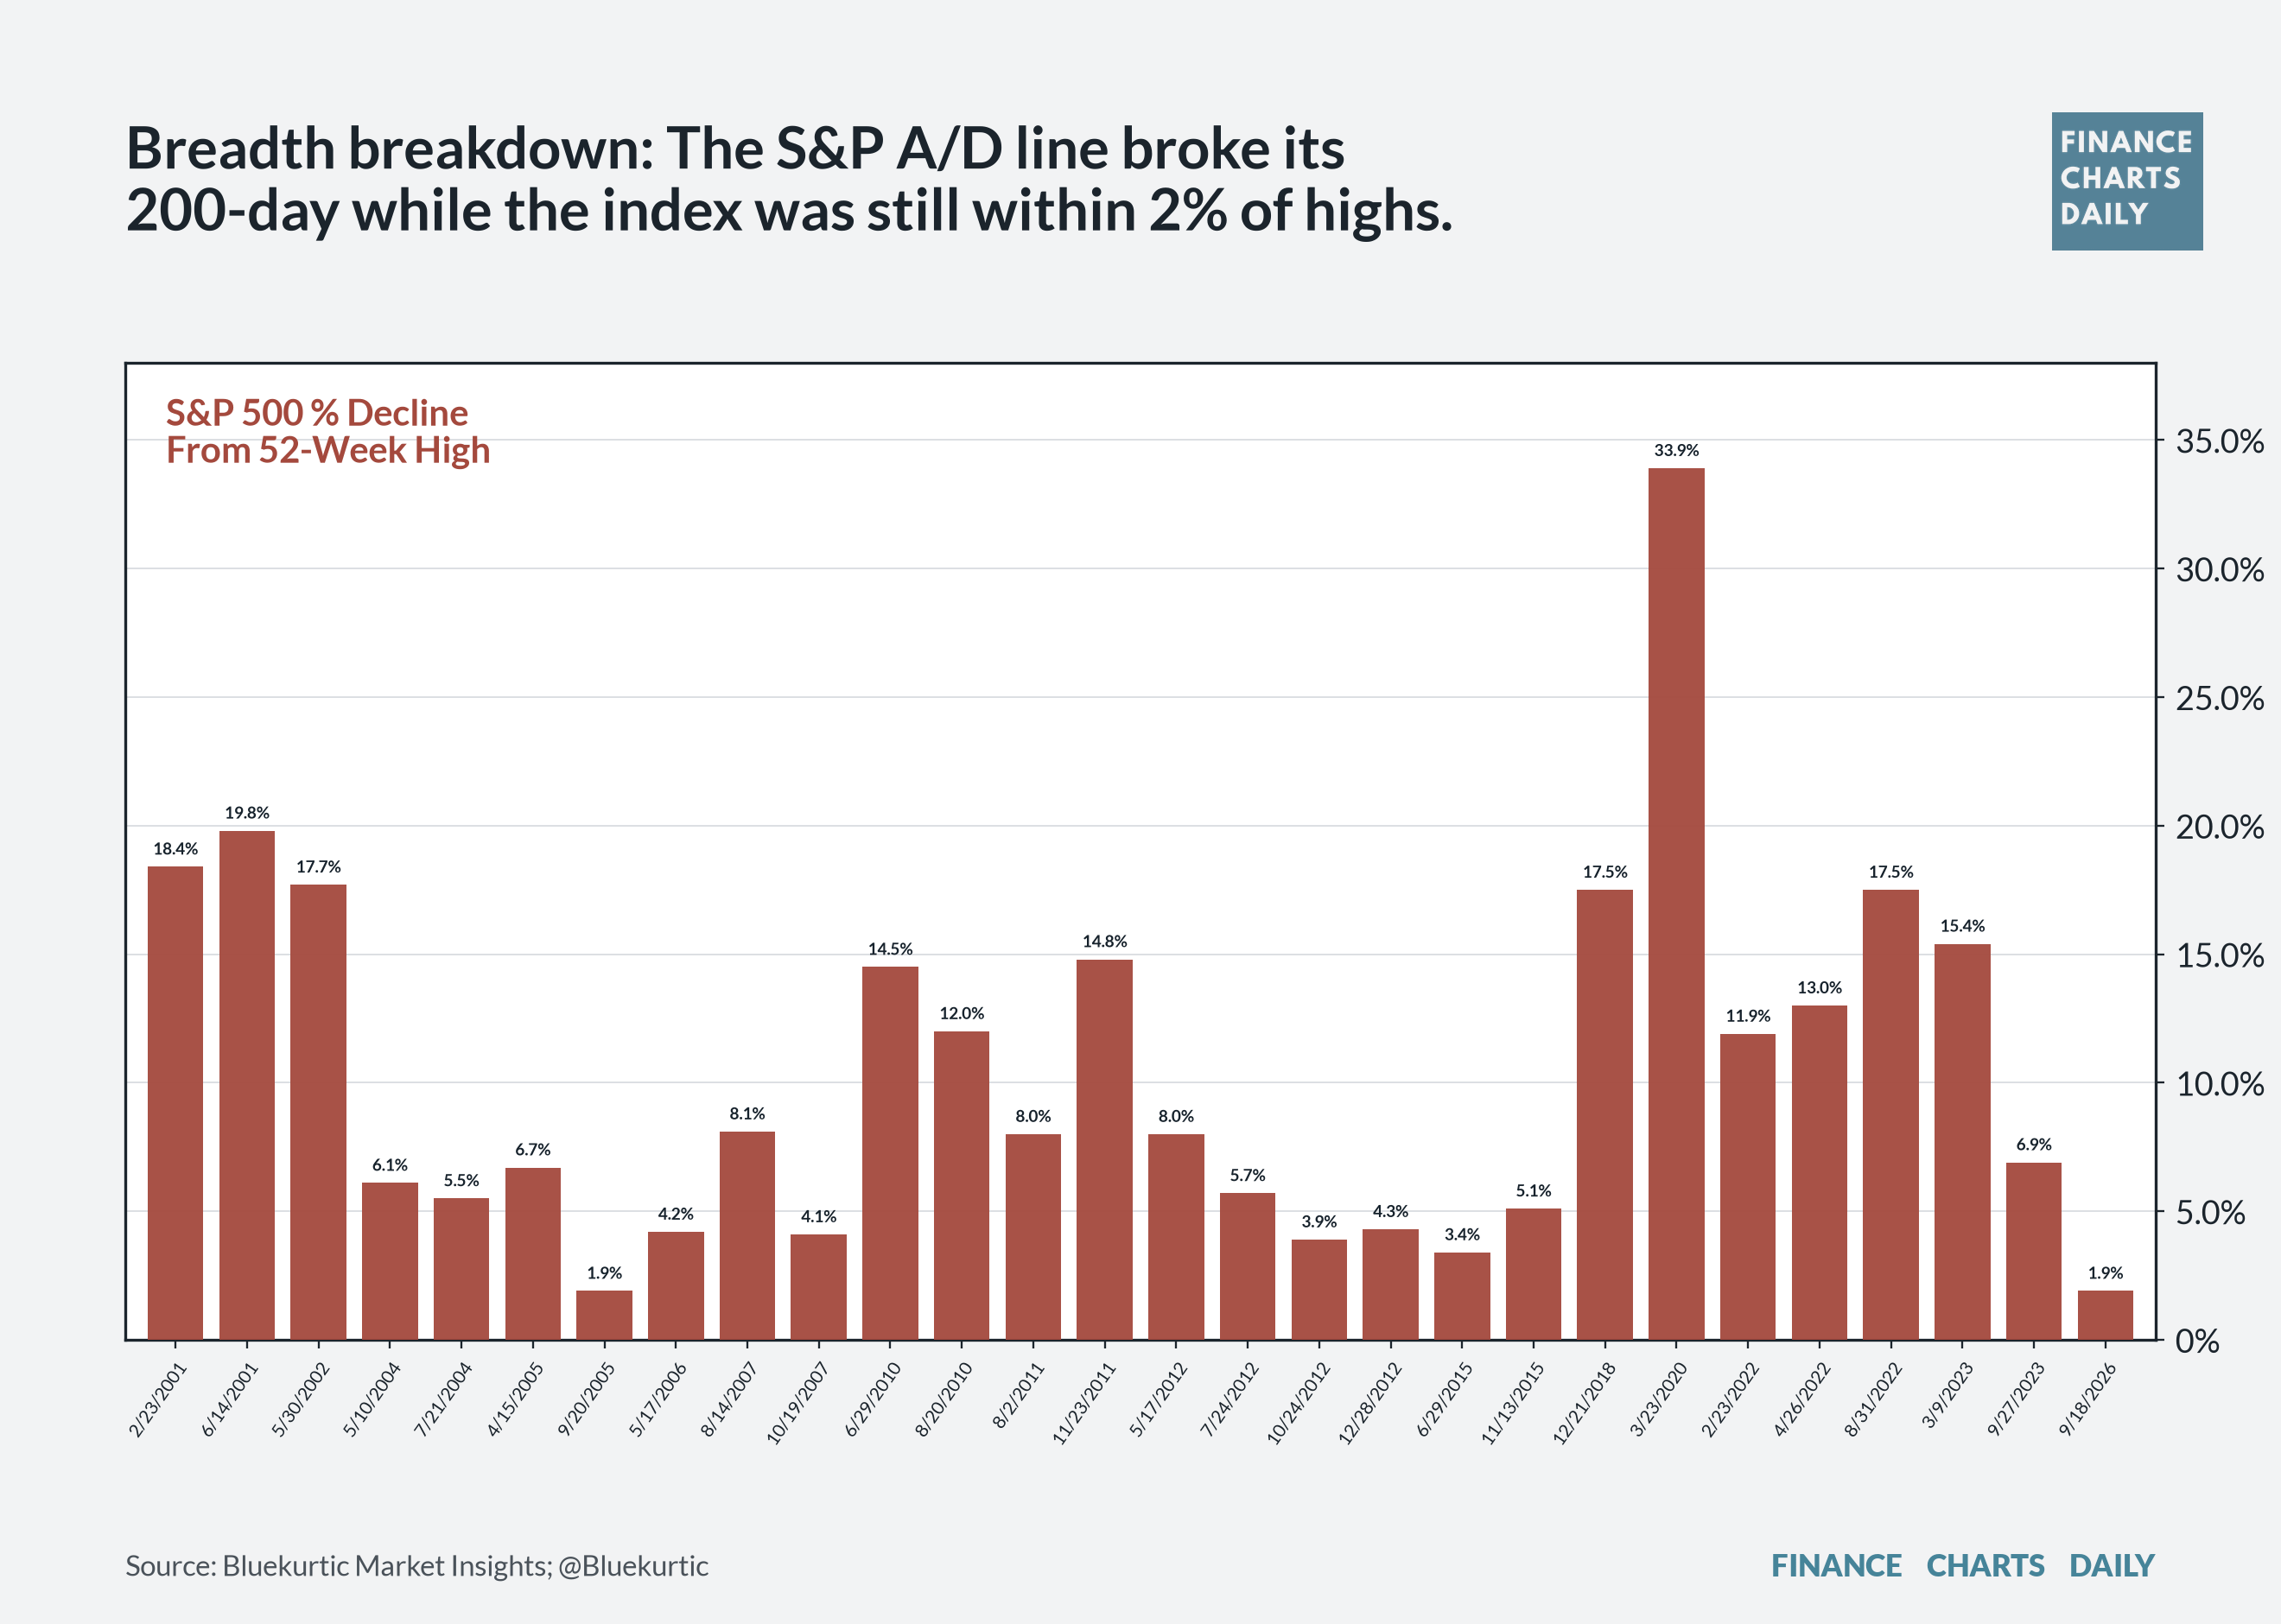
  1. Breadth breakdown: The S&P A/D line broke its 200-day while the index was still within 2% of highs.
Bluekurtic


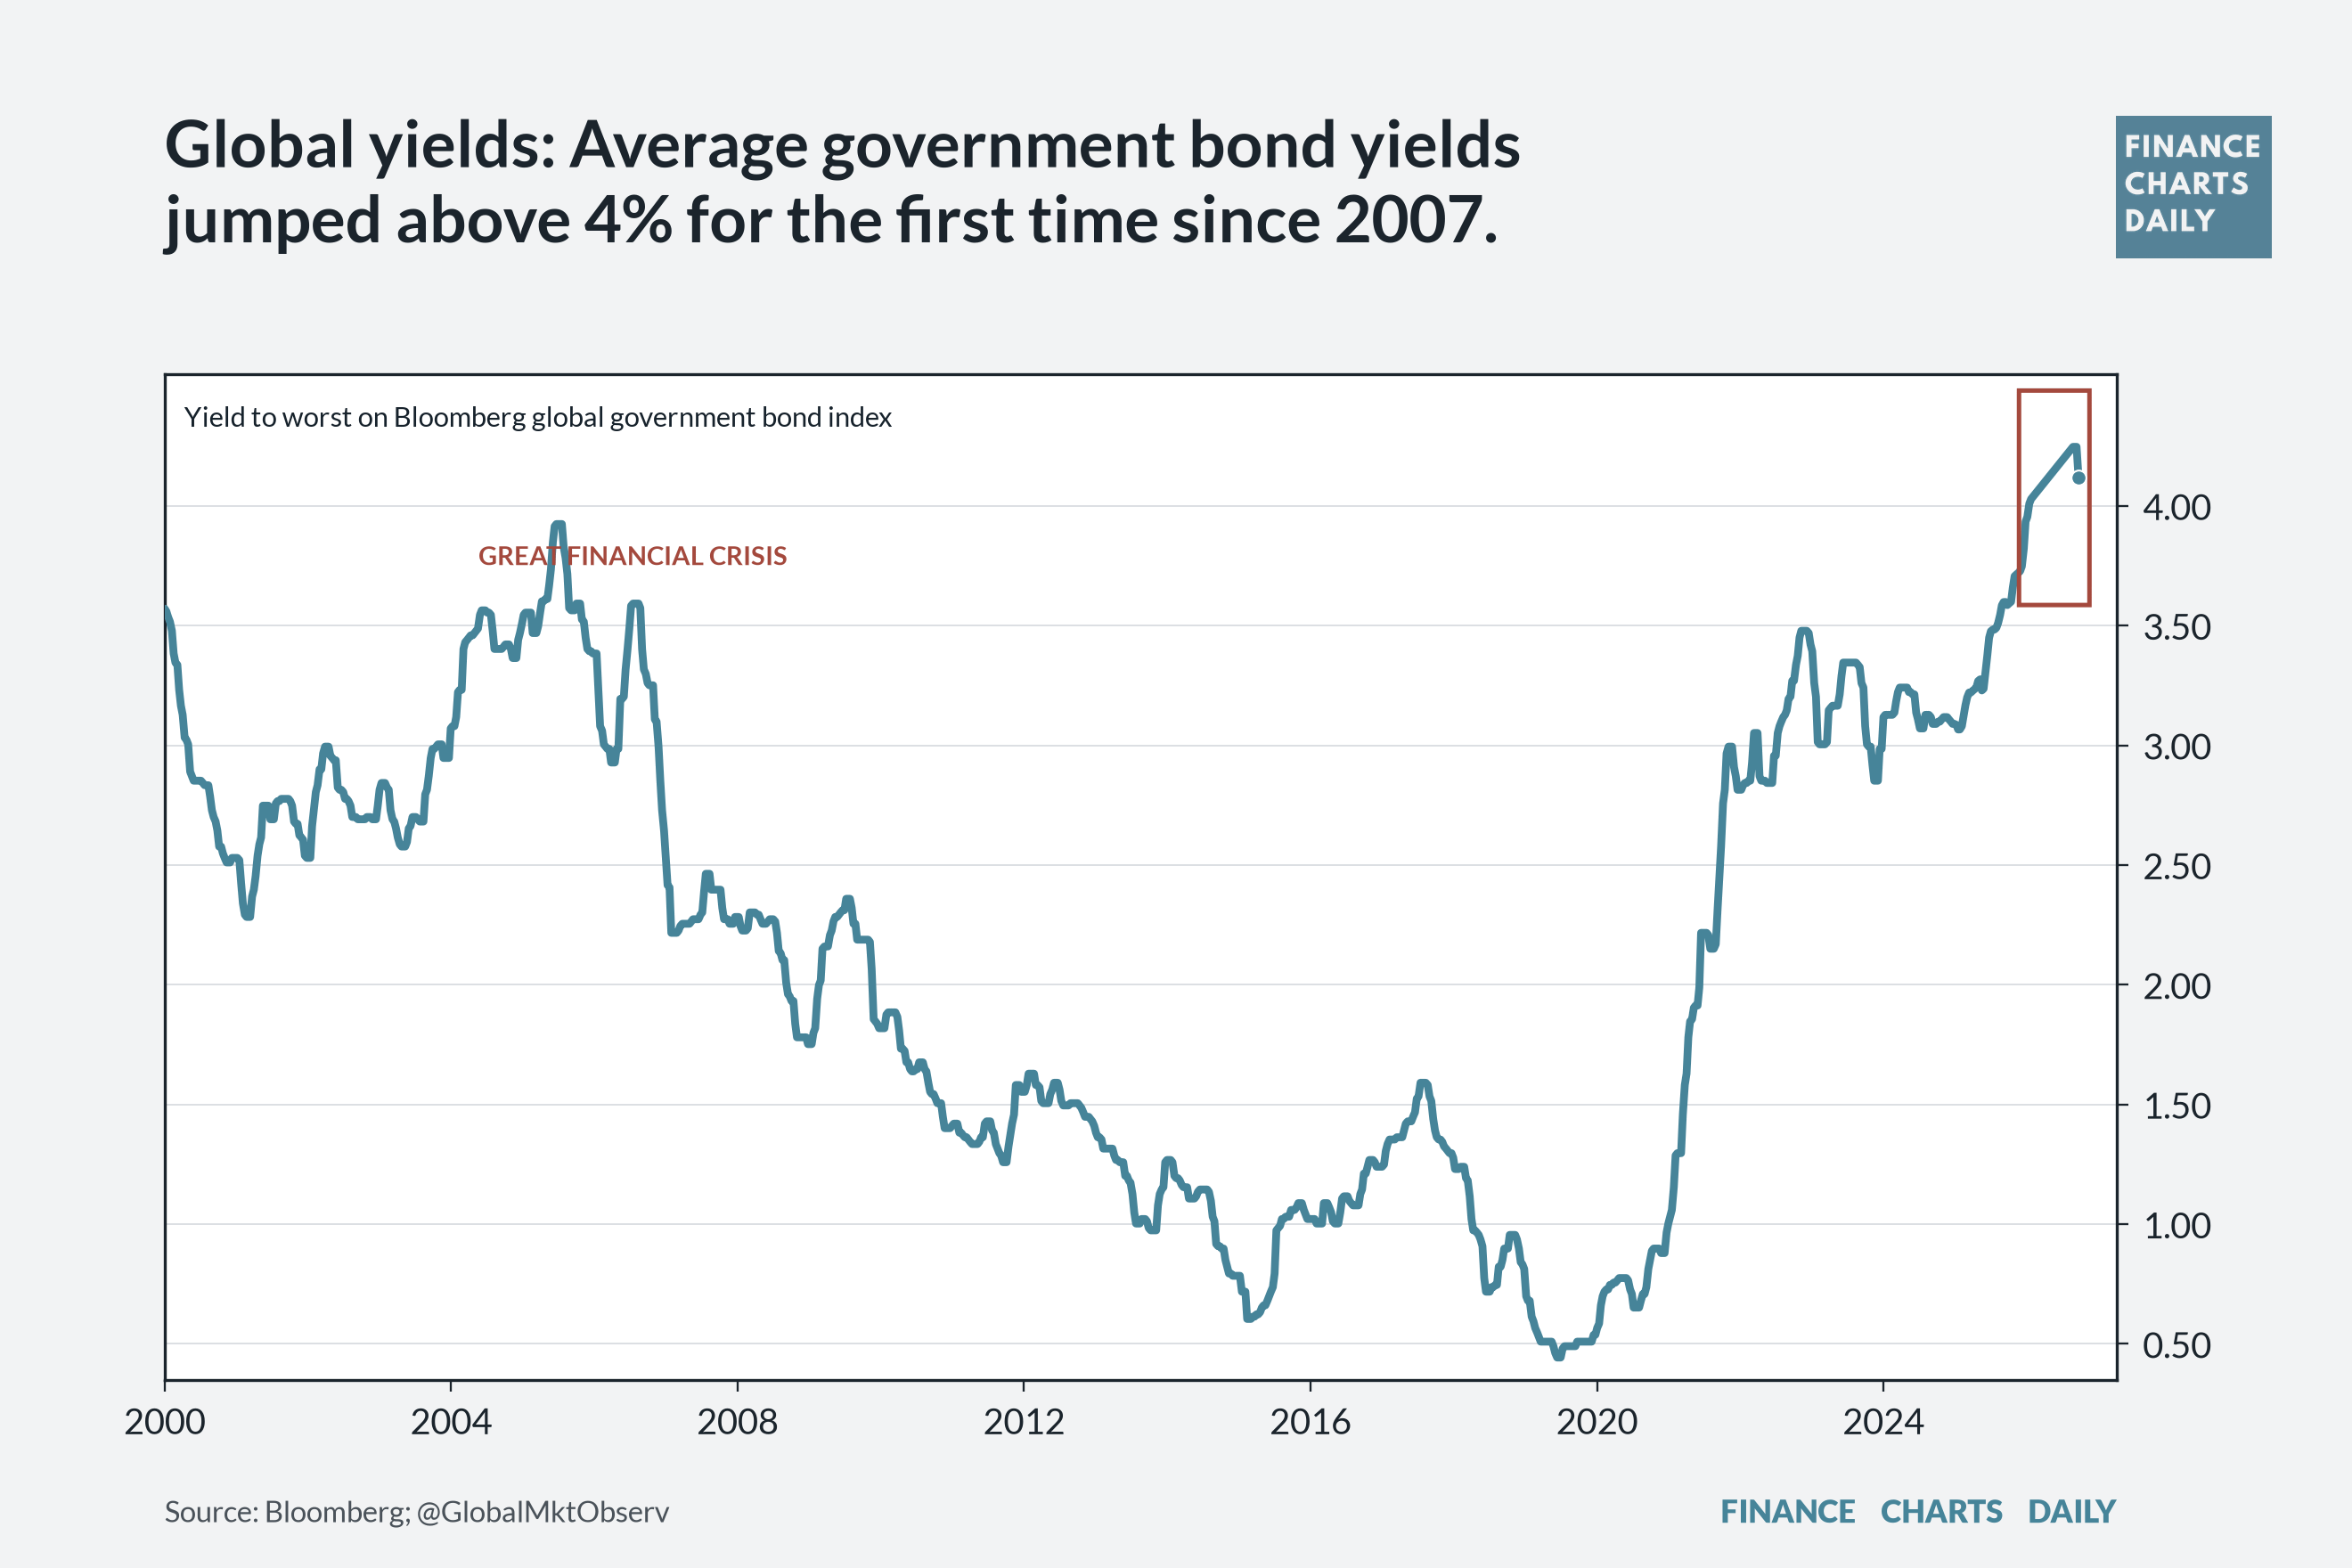
  1. Global yields: Average government bond yields jumped above 4% for the first time since 2007.
Global Markets Observer


User's avatar

Continue reading this post for free, courtesy of Mont Blanc Research.

Or purchase a paid subscription.
© 2026 Mont Blanc Research · Privacy ∙ Terms ∙ Collection notice
Start your SubstackGet the app
Substack is the home for great culture